There's been no material change in the counts since Friday. The bounce on Friday stayed within the crash channel, and as such did nothing to indicate a trend change, or even a slowing of the decline. However, as I talked about on Friday, indicators have all reached oversold levels, and sentiment has reached high bearish levels.
One tendency I've observed in many traders over the years is to continue "looking" for things after they've already occurred. Here's an example. Back on Nov. 18, I wrote:
Assuming my preferred count is correct, market surprises going forward should be to the downside. In third waves, momentum indicators reach oversold and stay there. Bounces that should materialize, often don't.
That has already happened, as indicators have been quite oversold for some time now, and expected bounces have been non-existent to this point. But as I wrote this past Friday, now is the time when I'm finally starting to look for a bounce, because the charts are finally justifying it.
Besides the chart potential, another argument in favor of a bullish move occurring is the fact that everything's gotten so bearish. Something has to give. The market is now like a rubber band that has been stretched to its limit: either it snaps back soon... or it breaks.
But after Thursday's action, I tried to convey on Friday that a bounce definitely became something to be cautious of if you're holding short positions. If we do see a bounce here, I expect it will simply be a snap-back rally, though it could retrace as high as 1220.
Regardless of whether we get a rally here or not, I am ultimately expecting lower prices over the medium and long term, and my preferred view is that the market will make new lows beneath 1074 before generating a more significant rally. As such, it is my preferred view that rallies going forward should be looked at as selling opportunities.
The charts continue to reflect the stretched rubber-band scenario, and this has made the short term quite challenging to decipher. Sometimes, the short term potentials can be narrowed down to the same direction (or at least a higher probability of one over the other), but in this case, they're diametrically opposed -- one says dramatically lower, one says markedly higher. In cases like this, I always think it best to let the market dictate.
The first chart examines what happens if the rubber band breaks. I have drawn two channel lines on this first chart. The black channel is the crash channel the market has been in for over a week, the red lines represent a larger linear regression channel.
A break of the black line would be our first warning that a decent bounce may be in the cards, and a break of the red line would serve as further confirmation. The technical invalidation (or knockout level) for this count occurs with any trade print above 1198.50.

I have also noted the position of RSI and MACD as something else to watch. Breaks below the recent lows on those indicators would indicate that the decline is accelerating again.
The second chart (below) shows how the bounce scenario could play out. This count is the same as shown on Friday, and views the recent decline as an extended fifth wave of blue 1 of red (iii). An extended fifth would suggest a rally all the way back up to the red wave (2) of blue v high, near 1220. I know everyone can do the math -- but that's 60 points up from here, which is another reason why caution is warranted for shorts.

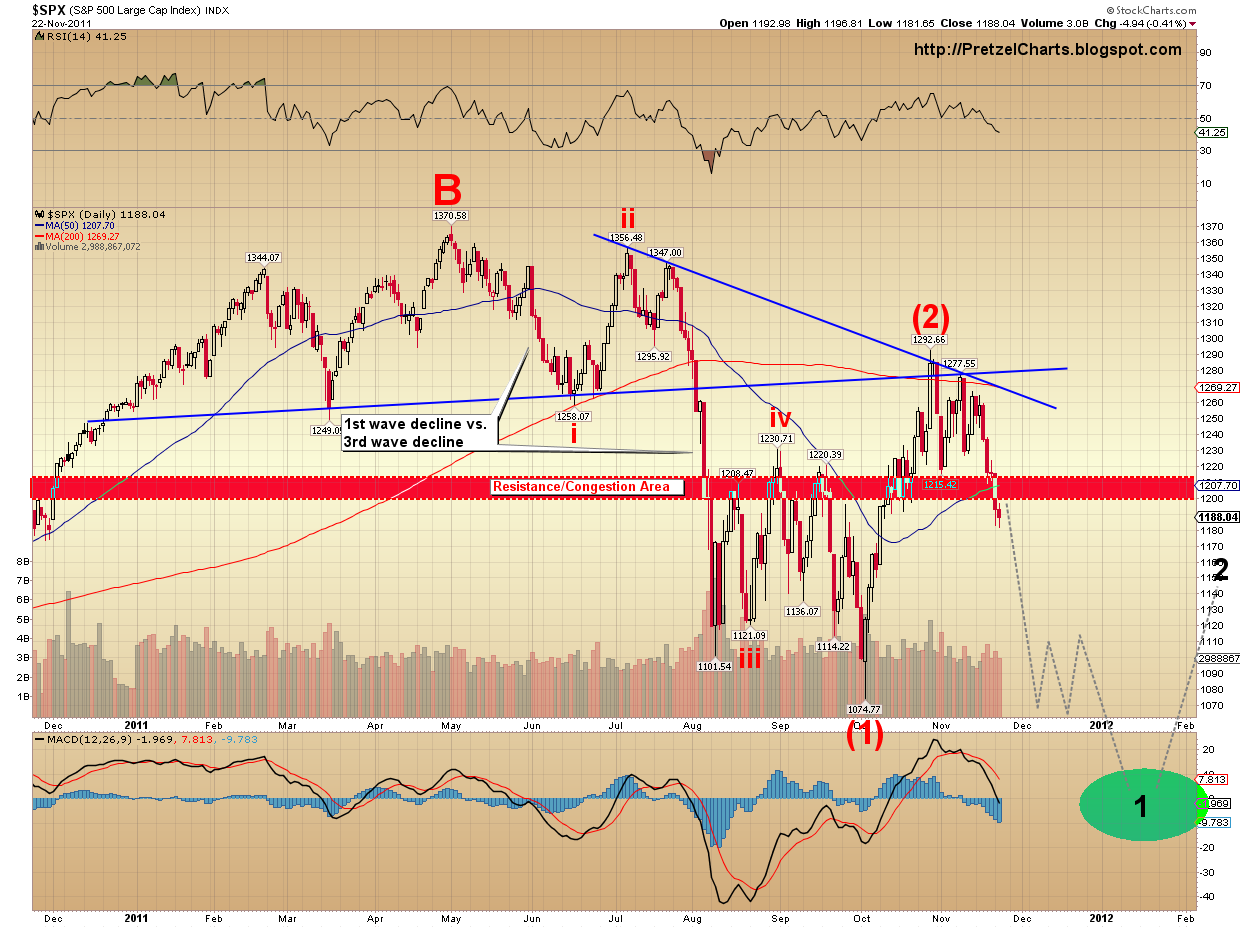
And finally, I haven't shown a chart of the bullish alternate count in a week, so it's time to update it. Interestingly, I haven't moved the blue target oval an inch since I originally created and posted this chart (pre-open) back on November 20. The market has now moved perfectly into the target oval. I continue to assign this count a low 15% probability, but this is certainly another reason for caution in short positions, since this count allows for 140 points, or more, upside -- and the market has entered the target zone, which means short positions become higher risk.
One of the reasons I continue to give this count low odds is the US Dollar chart. The Dollar seems to indicate that there is more upside in store for Dollar bulls -- and it will be hard for equities to stage a meaningful rally in the face of a rising dollar.
We should continue to watch this count carefully, however, and if a bounce materializes, I will update this chart as needed.

In conclusion, the short-term picture remains as vague as it was on Friday, and the market will simply have to clarify things however it sees fit. Long and medium term, I remain bearish. Trade safe.