The traditional wisdom is that light-volume holiday sessions, such as the sessions approaching on Wednesday and Friday, are bullish.
Since 1941, Black Friday (the day after Thanksgiving) has seen an average rise of 0.28%, and a positive close 70% of the time. Yesterday, I also mentioned that the day before Thanksgiving has been a green session in 8 of the prior 9 years.
There's a reason for this, and it has nothing to do with good holiday cheer. The simple fact is, the big hedge funds and commercials recognize that they can't dump huge quantities of inventory into a thinly-traded market, because the retail investors (i.e.- the suckers) aren't doing enough buying to support it. It would tank the market in a big way if there were heavy selling on these light volume days, which would mean they'd have to settle for even lower prices on their inventory on Monday. Their reasoning is to let it go up, then sell into strength when there's more volume.
In the past nine years, the only year in which Pre-Thanksgiving Wednesday closed lower was 2007; which was not long after the start of the previous bear market. Tomorrow, we might get a
tiny clue about just how desperate the big players are. If the market sees higher selling than usual during tomorrow's "traditionally green" session, it could lead to a large red candle on the charts.
But really, any close lower will be a confirmation of the market's underlying weakness. Thanksgiving week is historically
one of the best weeks of the entire year for the markets; if it's a bad week this year, then that's relevant information.
Another fun fact: the
Monday following Thanksgiving has been a negative day in 7 of the 9 past years. So even during the bull runs, the big players have been in distribution mode immediately after the light holiday sessions.
If my preferred count is correct, we are now at the very beginning of Minor (3) down. In Elliott Theory, each impulse wave is made up of five smaller waves, so more specifically, we are in wave 1-down of Minor (3) down. And if my
big picture count is correct, then this market is different than anything most of us have traded before. Under that count, we are in the midst of a third wave decline at Supercycle degree (alternately, we are in the midst of a
Grand Supercycle third wave down, which would be even more powerful).
This bear market is, in fact, an ongoing continuation of the 2007-2009 bear market; the entire rally from the March '09 lows was merely a large counter-trend correction, the B-Wave of the ongoing bear. 2007-09 was the A wave (a first wave), and this is the C-wave (a third wave).
The challenge of trading third waves can be that they often don't let traders in or out safely. Think of the recent run-up off the October lows: that was a C-wave, which is as counter-trend third wave. It stubbornly refused to pull back long enough to let the shorts out, or let new longs in. Eventually, everyone who missed the turn just had to buy into the teeth of it, which drove it relentlessly higher with no significant pull-backs. (The Horn Tooting Department wants me to mention that my readers didn't miss the rally, and were even warned about it well in advance, as shown in this article from
October 4.)
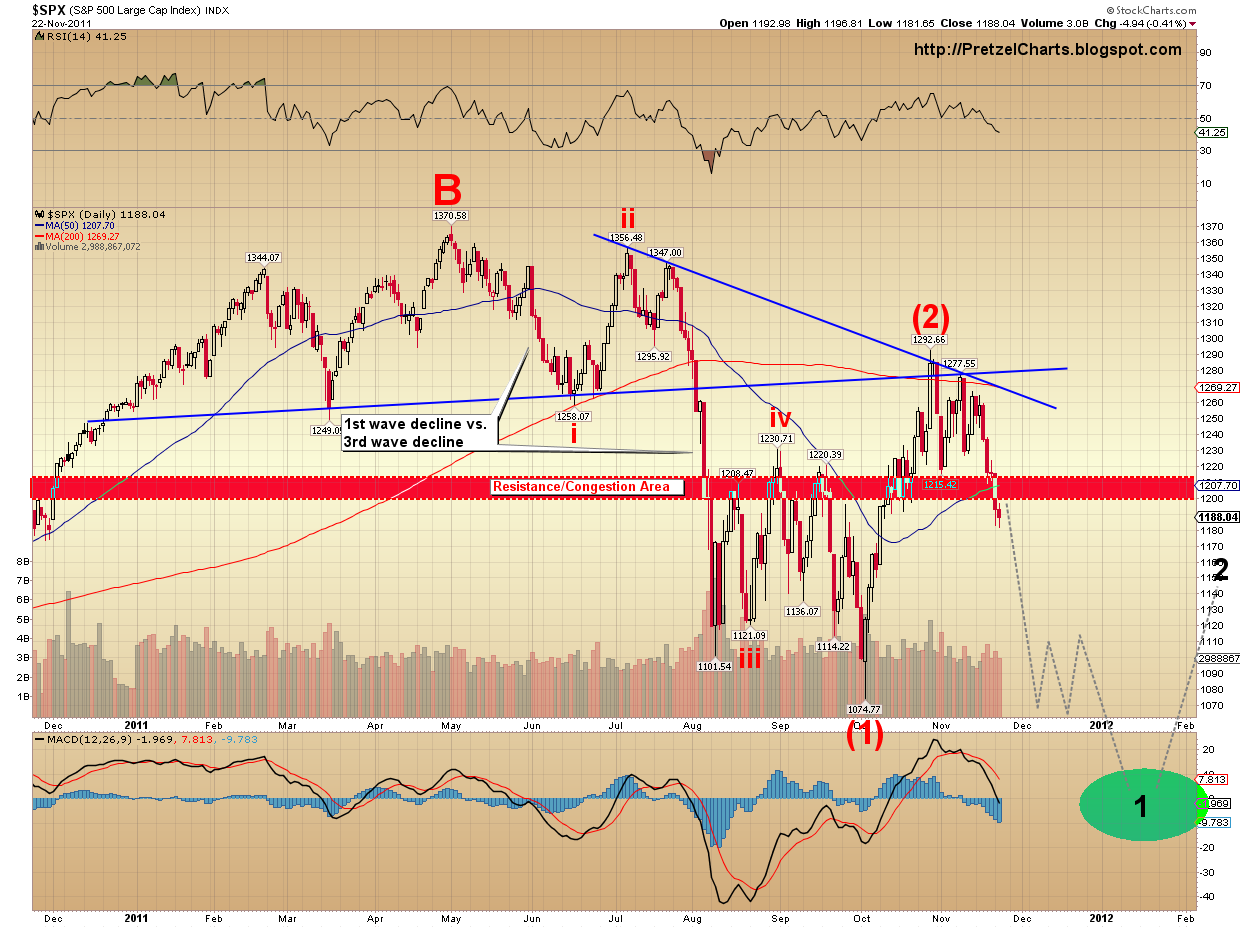
Anyway, to give you an idea of the difference between the power of a first and third wave, look at the chart below. The question I keep asking myself is: should
iii of (1) (prior waterfall) be more powerful than
1 of (3) (current waterfall)?
You'll also note the congestion zone of prior support. Theoretically, this zone should now be overhead resistance. Now, all that said, we are still not into the "meat" of Minor (3) down -- as you can see from the black "1" on the chart, we are only in the first sub-wave of Minor (3).
And all of this, of course, assumes my long term count is correct. When this wave approaches bottom, I will again rigorously challenge my assumptions in that regard. We lose the ability to navigate the market properly if we become too headstrong in our ideas of what "should" happen.
Thus far, the market continues to behave in accordance with my early November prediction of a waterfall decline. I have continued to try to narrow down the very short-term possibilities, so far with a good level of success. In a material sense, not much has really changed since yesterday.
Just to reiterate for new readers, my expecations are for this wave (wave 1-down of Minor (3) down) to carry the SPX into the 1000-1050 zone, although preliminary projections could stretch all the way down to the 800's. I'll narrow that down when we get closer, but that's my preferred medium term view.
In the ongoing effort to try and uncover the path we might take to reach the medium term targets, the two very short term options I presented yesterday are still in effect today.
The first (below) is the count I've been favoring over the short term since this leg of the decline began. It's a bearish nest of 1's and 2's and indicates that the market has yet to see the strongest wave of the decline; it also suggests that significant rallies will be few and far between. Under this count, the preliminary target for blue wave (iii) would be the 1150 area.
The blue (ii) can be knocked out if the SPX declines to 1175 or lower, then rallies back above the blue (ii) high. If that happens, the count shown in the second chart becomes far more likely, and we may see a day or two of rally.
I am now favoring the count above at 58% odds, up a little from yesterday. I would love to tell my readers exactly
why I'm favoring this, but in order to do so, I would be forced to reveal my
Proprietary Indicator of Potential Secrets (or
PIPS for short -- I considered multiple letter combinations here, but then added in "Potential" to keep the acronym "family friendly"). Obviously, I can't reveal it, or else
everyone would have one... and then I'd never be able to sell it to Goldman Sachs for so much money that I'll routinely be able to leave Cadillacs as tips. But even
PIPS isn't infallible, so a second short term possibility is outlined below.
The second possibility is the one being favored by most Elliott Wave analysts, since it's the safe and traditional way to look at things. It's certainly possible for this to be playing out; and statistically, it would seem like
one of these times I go out on a limb with my preferred view, I'm bound to be wrong. This view has the market making a short-term bottom in the 1168-1175 area, then bouncing up toward the blue target box. This would also fit the usual seasonality better, so maybe I'm an idiot to even suggest otherwise (and that thought
has crossed my mind on a number of occasions).
I'm giving this count 42% odds, so it's clearly possible, and there's certainly nothing definitive in the SPX chart to suggest it couldn't play out this way.
My preferred medium term view remains that Wave 1-down of Minor (3) down is now in process, however do remain aware of the bullish alternate count at this juncture. We are now entering territory where that alternate count could conceivably form a bottom, if my preferred count is wrong. I am keeping my odds at 15% for that count, as it simply doesn't fit well with everything I've been analyzing for the past month, but it's not impossible.
The decline so far is three waves -- so from a technical standpoint, it could either be the preferred count as outlined, with the fourth and fifth wave still to come, or it could be an ABC correction for the bullish alternate. Unfortunately, there's simply no way to know with
complete certainty at this point. This alternate would bottom soon and then rally up to new highs in the 1300's.
As I said, I consider this bullish alternate to be highly unlikely -- but the market does have a mind of its own. Trade safe.