Amazon

Thursday, December 1, 2011

SPX Update: Uncle Ben Saves the World?

Once upon a time, in a land far, far away from Europe, there lived a very generous Central Banker named Kindly Old Uncle Ben.  One day, Kindly Old Uncle Ben was happily cleaning his printing press, while humming the theme song from The Apprentice, when suddenly a powerful sorcerer appeared before him.  The sorcerer's name was Evil Lord Keynes. 

Evil Lord Keynes wanted to gain control of Uncle Ben's vast financial resources, but Uncle Ben staunchly refused.  Upon hearing this refusal, Evil Lord Keynes became very angry, and decided to place a curse on Kindly Old Uncle Ben.  Lord Keynes took three steps back from Uncle Ben and shouted his magic words: "Caveat Emptor!"  As his green cape billowed and coursed with the Infinite Powers of Fiat Currency, Evil Lord Keynes waved his magic wand (made of gold-plated plastic) and with a flick of his wrist, forever cursed Kindly Old Uncle Ben.  This wicked curse forced Uncle Ben to lend money, print money, and just generally throw money around at random in an almost compulsive fashion.

Which is pretty much where we find ourselves today.  (It all makes sense now, doesn't it?)

Needless to say, by now everyone who doesn't live in a geodesic dome somewhere in the Montana wilderness knows that yesterday, the Federal Reserve led an effort to coordinate six Central Banks in order to make it easier for everybody to borrow more US dollars.  Well, everybody except you, of course.  Especially if you're a middle-class American. 

No, this American money isn't really for Americans.  It's for foreign entities who -- if you can believe this -- have even less fiscal discipline than we do.  Basically, the Federal Reserve has reaffirmed its willingness to operate as the World's Largest Payday Loan Company.  The big difference between them and a real payday loan company is that the Fed's interest rates are way better.  Also, in order for you to borrow money from the Fed, it's not required that you actually have a paycheck coming at some point in the future.

Anyway, the market was quite excited by this news, and the Dow rallied approximately 20,000 points in the first five minutes.  That's how I remember it, anyway.  I think it sold off a bit later, though, and only closed up 400-something.  Maybe I should look at a chart.

The challenge with any type of analysis is that it's based on probabilities.  Technical analysis and Elliott Wave are ways to increase your probability of being on the correct side of the market.  However, no form of analysis is a crystal ball, due to the complexity of the system being analyzed, and the fact that not all circumstances can be foreseen. 

I'm happy that at least my charts from Monday and Tuesday were pointing to further upside, so hopefully not too many readers got caught wrong-footed.  But even I didn't see a move this strong coming.  Needless to say, the market blew through my projections, and all lines of resistance, as if they didn't exist.

The long-shot bullish alternate count I've been mentioning each day has suddenly become less of a long-shot.  There are a few things holding the old preferred count together, but in order for it to remain viable, the market needs to slow its advance and reverse very soon.

The preferred count didn't have any key levels violated on Wednesday -- however, its odds have to be adjusted to reflect the strength of the rally.  There are a couple other things that, in my mind, allow it to remain on the table for the time being, as follows.

One is the possibility that Wednesday was an exhaustion move, similar to October 27.  If you study the charts, you will see several similarities between the two moves.  In an exhaustion bar, the majority of the buyers get sucked in all at once, and the fuel gets spent so quickly that the market falls down shortly thereafter (sometimes after another day or two of sideways/up movement).

Another is the fact that, despite the joyful news from Kindly Old Uncle Ben, the TED spread remains at its highest level in more than two years, which is an indicator of continued systemic financial stress.  And a third is the fact that the "bottom" wasn't formed with too many of the usual factors that make bottoms.

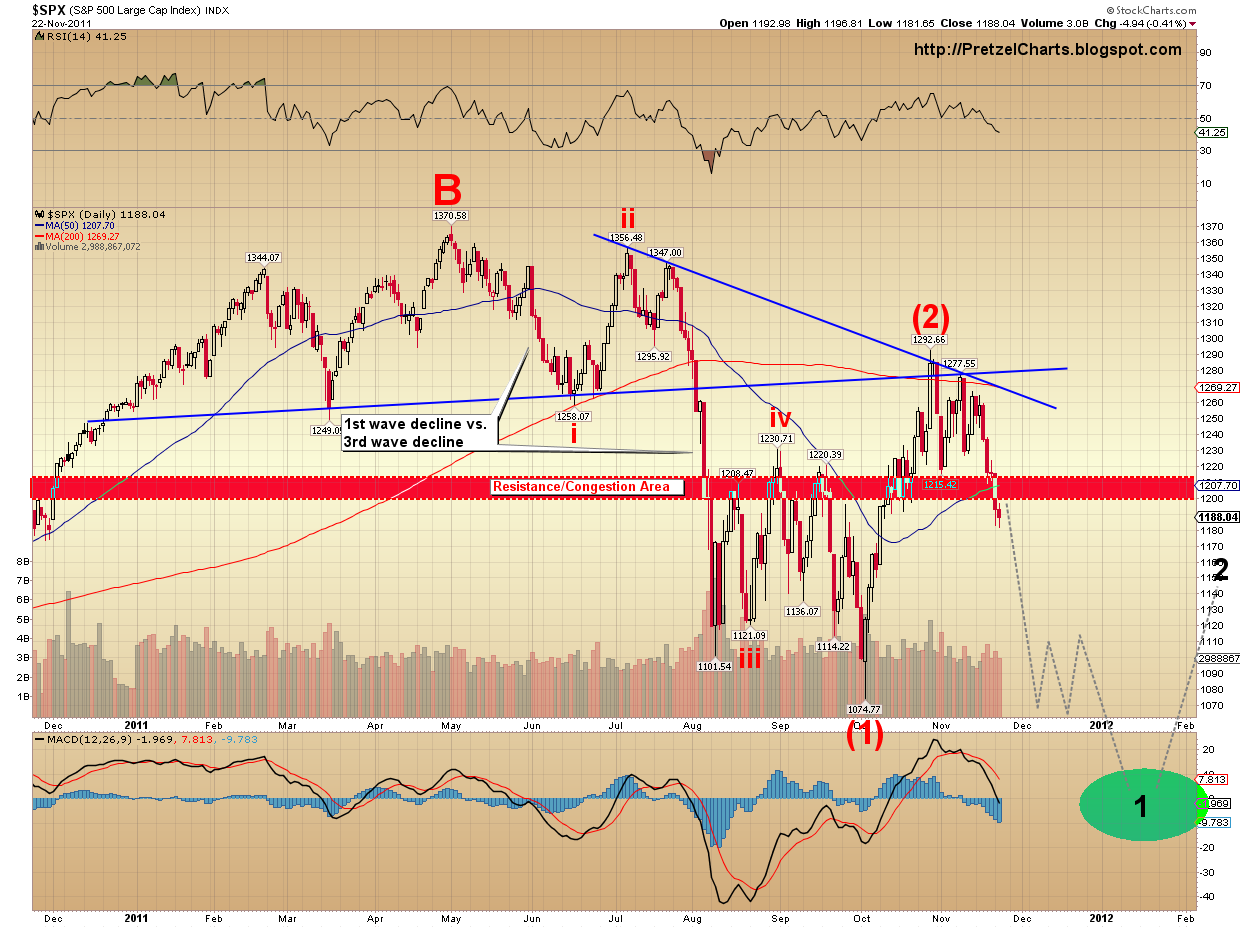
That said, this count could be eliminated quite quickly if the market doesn't oblige (see chart below):


The bullish alternate count has of course, roared into the spotlight, and could in the end prove to be the correct count.  I have illustrated on this chart one potential way for this count to unfold.  Please note that this illustration is largely speculative at this point, based on similar situations in the past (chart below).


I feel I have to increase the odds of this (short-term) bullish alternate to 35%. 

At this point, despite the massive three-day rally, there are still a few unanswered questions.  I remain medium and long term bearish, while the short term picture has become a bit clouded.  Things should clarify over the next few sessions, as the market gives us more information.  Trade safe.

The original article, and many more, can be found at http://PretzelCharts.blogspot.com

Wednesday, November 30, 2011

SPX Update: A Bit More Rally Still to Come?

There's been no material change in the counts since yesterday.  The expectation remains that new lows will follow this rally.  The primary question in my mind right now is whether that was it for the snap-back rally, or if there's one more new high coming.  The rally has not yet hit my preferred target range of 1209-1225, so I have a sneaking suspicion there's probably more to it.

On Monday, I talked about money flow, and how it was negative on that 3% up day, which indicates that the big money players were selling into strength, as opposed to accumulating positions.  This is not at all consistent with a meaningful bottom in the market.  The market cannot generate a sustainable rally unless the big money is buying, because obviously John and Mary Lunchbucket are not going to "move the market" this week by contributing eighty-seven dollars to their 401K.

For this reason, I would like to present a couple more follow-up charts on money flow.  The first one is from yesterday, and on this chart you can again see that "da Boyz" were in distribution mode:


The second chart is presented for contrast.  This chart is from October 5, and illustrates how the big players were accumulating stock after the last major bottom in the market:


I'm not going to show fifty-seven different examples of this, but it's a pretty consistent pattern.  Even near important short term bottoms, the heavy hitters are accumulating shares, not distributing them.  This would appear to be further evidence to support the preferred view that the rally is nothing more than a dead-cat bounce, and the primary trend is now down.

Again, the main question in my mind is whether the rally's over, or if there's more to it. 

The rally consisted of three waves up, and as such, could be complete. However, there is an interesting Elliott Wave phenomenon at work in this particular case, because the decline counts best as an extended fifth wave. Extended fifth waves have specific retracement targets, and they often perform complex "double" retracements. There are never any guarantees, but there are reasonable odds that we have only seen the first leg up of this type of double retracement.  A new high would also serve to turn sentiment around, and get more investors "bulled up" and believing that we just made an important low. 

Unfortunately, there is simply no way to say for certain exactly how the correction will play out.  By nature, corrections are much less predictable than impulse wave patterns.  The market already made it into the blue retracement target box, so until I see more clues from the market, all I can talk about at the moment is further probabilities  The chart below roughly depicts the two most likely possibilities.  Either the top of the rally was made on Tuesday, and we head down directly from here -- or we have one more leg up in store.

My preferred target for this bounce remains the same as it was yesterday: 1209-1225.  Specifically, 1222, but we'll see how close that comes.


In both cases, I am anticipating lower prices on the horizon.  My first short-term target after the rally ends is 1130-1140.  Medium term, I expect the SPX will head down toward 1000-1050.

Sustained trade above 1225-1230 would call this count into question, and if that happened, serious consideration would have to be given to the bullish alternate count, despite all present signs to the contrary.  Currently, I remain in favor of the view that this rally is short-term.  Trade safe.

The original article, and many more, can be found at http://PretzelCharts.blogspot.com

Monday, November 28, 2011

SPX Update: Sell the Bounce

The markets finally got some relief from the selling on Monday, bouncing from within the target zone of the extended fifth wave count.  I am now favoring that wave interpretation going forward. 

Most of the rally work was done by the futures market, after a short-covering panic was sparked by the (apparently unfounded) rumor that the IMF was going to attempt to bail out Italy by holding a huge raffle and a bake sale.  The rumor came under suspicion when it was discovered that the first place raffle prize allegedly being offered (described by the IMF as "a beautiful summer home") was, in fact, the Vatican.  The rumor was finally completely quashed when Christine Lagarde held a press conference and vehemently denied allegations that she had arranged the purchase of "massive quantities of pie shells and marshmallows."  The IMF indicated that its annual Winter Carnival and Face Painting Event would still be held on schedule.

Despite my disappointment upon learning that my hopes of winning a beautiful new home had been crushed, I continue to expect that this bounce will be short-lived.  There are a number of reasons for this expectation, described in detail as follows.  The first is that the bounce fits well very within the expectations of the extended fifth wave count.  In fact, not only did the bounce come from the target zone, but the area indicated on yesterday's chart is exactly where the rally ran into resistance. 

This count anticipates there is still a little bit more upside left, with the preferred target range falling between 1209 and 1225 SPX.  This target range assumes that the move down yesterday competed the b-wave of blue wave 2 (see chart below).  It's difficult to say if the b-wave completed though, so a little more downside is certainly possible before we move above yesterday's high.

I should also note that, given the market's position, it would not surprise me if these counter-trend rally targets were missed.  If my big picture count is correct, the larger waves pressing down on this market could compress the smaller waves and create upside failures, as they seemed to do earlier in the month. 


Another reason to be skeptical of the rally is that the money flow yesterday was negative, particularly in large block trades.  This indicates that the big money players were selling into yesterday's strength, while the retail investors were buying.  Negative money flow on a 3% up day is a sign of underlying weakness in the market.  Below are the numbers showing yesterday's money flow:


The next chart depicts my preferred count's expectations of what could happen when the rally ends.  I believe we have only completed the first wave (blue 1) of red wave (iii) down.  The current rally is blue wave 2 of red (iii).  Blue wave 3 should follow the rally, and carry the market rapidly to new lows.  My medium term view has been, and continues to be, that the market will ultimately knock out the October lows.  If my preferred count is correct, blue wave 3 now has the potential to test the October lows all by itself, which means we could approach new lows quite rapidly after this rally ends.  And there would still be more downside to follow after another correction in blue wave 4 (not shown).


Sustained trade above 1225 would call this count into question, and would lend credence to the bullish alternate count shown yesterday.

Of some note, the psychology of sudden hope among investors and traders on Monday is consistent with a second wave.  Second waves at all levels are times of hope, either a little hope (such as in a small second wave, like now) or a lot of hope (for a larger second wave, like in October).  The next wave is a third wave down, and -- as I've talked about many times in the past -- that suggests a "point of recognition" is coming for the masses.  If my preferred count is correct, bad news will soon be received very negatively.

In conclusion, my expectation is that there might be a little more upside tomorrow to wrap up the snap-back rally.  But whether the market reverses immediately tomorrow, or bounces around for a couple days, I expect new lows below 1150 on deck very soon.  Trade safe.

The original article, and many more, can be found at http://PretzelCharts.blogspot.com

US Dollar Update: More Upside for the Dollar?

[NOTE:  The Weekend SPX Update is posted immediately below]

[My long-term dollar count/charts can be found in this article (which also nailed the bottom last month)]

This is a quick dollar update, since so many markets are tied to the dollar right now. 

The dollar appears to have completed a five wave sequence on Friday, to wrap up wave (3).  It is now due to correct down toward the 78.880-78.925 level in wave (4).  In a perfect world, dollar bulls would see a rally develop from this zone, which would carry the dollar up toward the 80.5-81 level.

The critical level to watch is the wave (1) high at 78.605 -- a break there would indicate something else is going on.  A break of 77.840 would be a fatal blow to the preferred count, and would indicate the alternate count was likely to be unfolding, which would see the dollar attempt a retest of the recent lows at the wave ii/Alt: A label.

The preferred count agrees with the current equity market counts, which indicate a correction is due for both markets.  For equities, that means a brief rally, and for the dollar, a brief decline.  The dollar will hopefully provide some early warning if the equities rally is to become more than a correction --  but currently, there is nothing to indicate any medium or long term trend changes in either market.  Trade safe.


Sunday, November 27, 2011

SPX Update: Bounce or Die

Last week, the market wrapped up its worst Thanksgiving week since 1932, losing almost 5%, as I opined would happen the week before. 

There's been no material change in the counts since Friday.  The bounce on Friday stayed within the crash channel, and as such did nothing to indicate a trend change, or even a slowing of the decline.   However, as I talked about on Friday, indicators have all reached oversold levels, and sentiment has reached high bearish levels.

One tendency I've observed in many traders over the years is to continue "looking" for things after they've already occurred.  Here's an example.  Back on Nov. 18, I wrote:

Assuming my preferred count is correct, market surprises going forward should be to the downside. In third waves, momentum indicators reach oversold and stay there. Bounces that should materialize, often don't.  

That has already happened, as indicators have been quite oversold for some time now, and expected bounces have been non-existent to this point.  But as I wrote this past Friday, now is the time when I'm finally starting to look for a bounce, because the charts are finally justifying it.

Besides the chart potential, another argument in favor of a bullish move occurring is the fact that everything's gotten so bearish.  Something has to give. The market is now like a rubber band that has been stretched to its limit: either it snaps back soon... or it breaks. 

But after Thursday's action, I tried to convey on Friday that a bounce definitely became something to be cautious of if you're holding short positions.  If we do see a bounce here, I expect it will simply be a snap-back rally, though it could retrace as high as 1220. 

Regardless of whether we get a rally here or not, I am ultimately expecting lower prices over the medium and long term, and my preferred view is that the market will make new lows beneath 1074 before generating a more significant rally.  As such, it is my preferred view that rallies going forward should be looked at as selling opportunities.

The charts continue to reflect the stretched rubber-band scenario, and this has made the short term quite challenging to decipher.  Sometimes, the short term potentials can be narrowed down to the same direction (or at least a higher probability of one over the other), but in this case, they're diametrically opposed -- one says dramatically lower, one says markedly higher.  In cases like this, I always think it best to let the market dictate.

The first chart examines what happens if the rubber band breaks.  I have drawn two channel lines on this first chart.  The black channel is the crash channel the market has been in for over a week, the red lines represent a larger linear regression channel. 

A break of the black line would be our first warning that a decent bounce may be in the cards, and a break of the red line would serve as further confirmation.  The technical invalidation (or knockout level) for this count occurs with any trade print above 1198.50.


I have also noted the position of RSI and MACD as something else to watch.  Breaks below the recent lows on those indicators would indicate that the decline is accelerating again.

The second chart (below) shows how the bounce scenario could play out.  This count is the same as shown on Friday, and views the recent decline as an extended fifth wave of blue 1 of red (iii).  An extended fifth would suggest a rally all the way back up to the red wave (2) of blue v high, near 1220.  I know everyone can do the math -- but that's 60 points up from here, which is another reason why caution is warranted for shorts.


And finally, I haven't shown a chart of the bullish alternate count in a week, so it's time to update it.  Interestingly, I haven't moved the blue target oval an inch since I originally created and posted this chart (pre-open) back on November 20.  The market has now moved perfectly into the target oval.  I continue to assign this count a low 15% probability, but this is certainly another reason for caution in short positions, since this count allows for 140 points, or more, upside -- and the market has entered the target zone, which means short positions become higher risk.

One of the reasons I continue to give this count low odds is the US Dollar chart.  The Dollar seems to indicate that there is more upside in store for Dollar bulls -- and it will be hard for equities to stage a meaningful rally in the face of a rising dollar.

We should continue to watch this count carefully, however, and if a bounce materializes, I will update this chart as needed.


In conclusion, the short-term picture remains as vague as it was on Friday, and the market will simply have to clarify things however it sees fit.  Long and medium term, I remain bearish.  Trade safe.

Friday, November 25, 2011

SPX Update: The Crash: 1; Seasonality: 0

As predicted, Wednesday's normally seasonally-bullish session turned into a big red candle.  That in itself should tell us something about this market, as that marks only the second time in ten years that the Wednesday before Thanksgiving has been negative.  The only other time that's happened in the previous nine years was in 2007, during the prior down leg of the Great Bear.

Now, that said, here's where things start to get interesting.  Despite the fact that price has performed  exactly as I've been predicting, my indicators are now giving some conflicting signals.  I'll come back to that in a moment, but first:  it's human nature to get complacent when things go perfectly according to plan, as they have for my readers.  However, the stock market is no place for complacency.  Please don't be tempted to get lazy here; I'd hate to see anyone give up their 100+ points of SPX profit at this point. 

The charts are now in a bit of flux.  One of the things that bothers me at the moment is that the SPX has not shown a clear internal third wave within the indicators.  This means one of two things:

Option 1)  The market has been forming a fifth wave extension, and could see a strong counter-trend bounce soon.

Option 2)  The decline hasn't yet seen the internal third wave.  This would have immediate and exceptionally high bearish implications.

The challenge I'm running into right now is ambiguity across markets, from currencies to equities.  If I had to make a call, I would continue to lean toward the more bearish short-term outcome, as I have for some time -- but the charts are almost a toss-up at the moment, more so than they have been previously.  Friday and Monday should hold the answer.

Long and medium term, I remain bearish.  My short-term stance is described above.  If the market can't generate a bounce from somewhere near the current levels, it is almost certainly in very deep trouble, and we should see strong acceleration in the decline... or an outright crash.

Incidentally, the Euro is in a similar position.  It needs to get back above 1.33, and then 1.35, pretty quick -- or 1.10-1.15 becomes fair game.

Let's look at the two possibilities for SPX in chart form.  The first chart depicts the fifth wave extension (option 1 above).  This chart suggests a short-term bottom is near, and predicts a decent retracement rally, which would likely carry all the way back up to 1215-1222 before the decline resumes.  This count flies in the face of my belief that we wouldn't see any significant rallies during this decline, but I have to stay true to the charts.


The second chart (option 2; chart below) depicts an ongoing nest of first and second waves.  This count is downright scary, and would suggest the bomb bay doors are about to open on this market. 

I would suggest paying attention to the black trend-channel for clues.  A clean break up and out of the channel would tend to favor the count shown above; a break below the channel would favor the count shown below (see how easy I made that?).  In either case, until the top trend line is broken, there is really nothing to suggest a trend change over the short term, and the first chart (shown above) remains a hypothetical.


Over the holiday, a number of readers inquired about the VIX, and how it seems to be unresponsive to the decline.  Using history as our guide, and given the market's position within the big picture waveform, this apprears to have happened the last time as well.  I have created a chart which shows 2008, the last time the market was in a similar position in regards to its wave structure. 

The wave we are currently in is believed to be black Wave 1-down of red Minor (3) down, which should make a new low in the SPX 1000-1050 range before bouncing in black Wave 2-up.  In the chart below, we can see that last time this happened, the VIX failed to make a new high, even as the SPX made a new low.


Of course, it is still not possible to rule out the short-term bullish alternate count, and will remain so until the market completes five waves down at higher degree. (See: SPX and NDX Update: Crash Wave Finally on Deck).  I continue to assign a 15% probability to this bullish count, but again, the market's in the area where that count could bottom, so I would suggest that some degree of caution is in order, as the bullish count would generate a rally back up over 1300. 

At the moment, we have a market that has left its short-term options open.  Friday is another "seasonally bullish" day, with data going back to 1941 indicating that the post-Thanksgiving Friday is green 70% of the time.  The Crash scored a touchdown on Wednesday, after Seasonality got flagged for too many false starts.  Can it score another tomorrow, or will the bulls regroup?  As Chris Berman would say, "That's why they play the games, folks!" 

The bottom line is the bulls need to get in the game, and fast, or the bears are going to run the length of the field on this one.  Trade safe.

The original article, and many more, can be found at http://PretzelCharts.blogspot.com 

Wednesday, November 23, 2011

SPX Update: The Crash vs. Seasonality: Round One

The traditional wisdom is that light-volume holiday sessions, such as the sessions approaching on Wednesday and Friday, are bullish.

Since 1941, Black Friday (the day after Thanksgiving) has seen an average rise of 0.28%, and a positive close 70% of the time.  Yesterday, I also mentioned that the day before Thanksgiving has been a green session in 8 of the prior 9 years.

There's a reason for this, and it has nothing to do with good holiday cheer.  The simple fact is, the big hedge funds and commercials recognize that they can't dump huge quantities of inventory into a thinly-traded market, because the retail investors (i.e.- the suckers) aren't doing enough buying to support it.  It would tank the market in a big way if there were heavy selling on these light volume days, which would mean they'd have to settle for even lower prices on their inventory on Monday.  Their reasoning is to let it go up, then sell into strength when there's more volume.

In the past nine years, the only year in which Pre-Thanksgiving Wednesday closed lower was 2007; which was not long after the start of the previous bear market. Tomorrow, we might get a tiny clue about just how desperate the big players are.  If the market sees higher selling than usual during tomorrow's "traditionally green" session, it could lead to a large red candle on the charts.

But really, any close lower will be a confirmation of the market's underlying weakness.  Thanksgiving week is historically one of the best weeks of the entire year for the markets; if it's a bad week this year, then that's relevant information. 

Another fun fact: the Monday following Thanksgiving has been a negative day in 7 of the 9 past years.  So even during the bull runs, the big players have been in distribution mode immediately after the light holiday sessions. 

If my preferred count is correct, we are now at the very beginning of Minor (3) down.  In Elliott Theory, each impulse wave is made up of five smaller waves, so more specifically, we are in wave 1-down of Minor (3) down.  And if my big picture count is correct, then this market is different than anything most of us have traded before.  Under that count, we are in the midst of a third wave decline at Supercycle degree (alternately, we are in the midst of a Grand Supercycle third wave down, which would be even more powerful).

This bear market is, in fact, an ongoing continuation of the 2007-2009 bear market; the entire rally from the March '09 lows was merely a large counter-trend correction, the B-Wave of the ongoing bear.  2007-09 was the A wave (a first wave), and this is the C-wave (a third wave). 

The challenge of trading third waves can be that they often don't let traders in or out safely. Think of the recent run-up off the October lows: that was a C-wave, which is as counter-trend third wave. It stubbornly refused to pull back long enough to let the shorts out, or let new longs in. Eventually, everyone who missed the turn just had to buy into the teeth of it, which drove it relentlessly higher with no significant pull-backs.  (The Horn Tooting Department wants me to mention that my readers didn't miss the rally, and were even warned about it well in advance, as shown in this article from October 4.) 

Anyway, to give you an idea of the difference between the power of a first and third wave, look at the chart below.  The question I keep asking myself is: should iii of (1) (prior waterfall) be more powerful than 1 of (3) (current waterfall)?


You'll also note the congestion zone of prior support.  Theoretically, this zone should now be overhead resistance.  Now, all that said, we are still not into the "meat" of Minor (3) down -- as you can see from the black "1" on the chart, we are only in the first sub-wave of Minor (3).

And all of this, of course, assumes my long term count is correct.  When this wave approaches bottom, I will again rigorously challenge my assumptions in that regard.  We lose the ability to navigate the market properly if we become too headstrong in our ideas of what "should" happen.

Thus far, the market continues to behave in accordance with my early November prediction of a waterfall decline.  I have continued to try to narrow down the very short-term possibilities, so far with a good level of success.  In a material sense, not much has really changed since yesterday.

Just to reiterate for new readers, my expecations are for this wave (wave 1-down of Minor (3) down) to carry the SPX into the 1000-1050 zone, although preliminary projections could stretch all the way down to the 800's.  I'll narrow that down when we get closer, but that's my preferred medium term view.

In the ongoing effort to try and uncover the path we might take to reach the medium term targets, the two very short term options I presented yesterday are still in effect today. 

The first (below) is the count I've been favoring over the short term since this leg of the decline began.  It's a bearish nest of 1's and 2's and indicates that the market has yet to see the strongest wave of the decline; it also suggests that significant rallies will be few and far between.  Under this count, the preliminary target for blue wave (iii) would be the 1150 area.

The blue (ii) can be knocked out if the SPX declines to 1175 or lower, then rallies back above the blue (ii) high.  If that happens, the count shown in the second chart becomes far more likely, and we may see a day or two of rally.


I am now favoring the count above at 58% odds, up a little from yesterday.  I would love to tell my readers exactly why I'm favoring this, but in order to do so, I would be forced to reveal my Proprietary Indicator of Potential Secrets (or PIPS for short --  I considered multiple letter combinations here, but then added in "Potential" to keep the acronym "family friendly").  Obviously, I can't reveal it, or else everyone would have one... and then I'd never be able to sell it to Goldman Sachs for so much money that I'll routinely be able to leave Cadillacs as tips.  But even PIPS isn't infallible, so a second short term possibility is outlined below.

The second possibility is the one being favored by most Elliott Wave analysts, since it's the safe and traditional way to look at things.  It's certainly possible for this to be playing out; and statistically, it would seem like one of these times I go out on a limb with my preferred view, I'm bound to be wrong.  This view has the market making a short-term bottom in the 1168-1175 area, then bouncing up toward the blue target box.  This would also fit the usual seasonality better, so maybe I'm an idiot to even suggest otherwise (and that thought has crossed my mind on a number of occasions). 

I'm giving this count 42% odds, so it's clearly possible, and there's certainly nothing definitive in the SPX chart to suggest it couldn't play out this way.


My preferred medium term view remains that Wave 1-down of Minor (3) down is now in process, however do remain aware of the bullish alternate count at this juncture.  We are now entering territory where that alternate count could conceivably form a bottom, if my preferred count is wrong.  I am keeping my odds at 15% for that count, as it simply doesn't fit well with everything I've been analyzing for the past month, but it's not impossible. 

The decline so far is three waves -- so from a technical standpoint, it could either be the preferred count as outlined, with the fourth and fifth wave still to come, or it could be an ABC correction for the bullish alternate.  Unfortunately, there's simply no way to know with complete certainty at this point.  This alternate would bottom soon and then rally up to new highs in the 1300's. 

As I said, I consider this bullish alternate to be highly unlikely -- but the market does have a mind of its own.  Trade safe.

The original article, and many more, can be found at http://PretzelCharts.blogspot.com