Amazon

Sunday, July 15, 2012

SPX and RUT Updates: A Warning about Range-Bound Markets


In Friday's analysis, I showed a bullish and bearish option on the 15-minute chart -- with the bullish option having found a bottom at SPX 1325 -- and I expressed my opinion that the bears still needed another swing low in order to take control of the market.  It appears they won't get it, at least not immediately.

The 1-minute SPX chart I projected on Friday suggested higher prices were due fairly directly, and I cited a 14 point bullish trade trigger which would become active with trade above 1339.  The trigger was activated early in the session, and the 1353 target was easily reached and bested.  The market appeared strong and has already retraced roughly 2/3 of the entire decline, in only 1/3 the time taken by the decline. 

On Thursday and Friday, the bulls literally reversed the market with barely a handful of points to spare (the Dow Jones Industrials came within a mere 42 points of completely invalidating the bull option -- this is what I was referring to when I said bulls were "on thin ice.").  Bears may have to wait a bit in order to regain control, but in a moment I'll cover why this isn't as entirely clear-cut as it may seem, at least not yet.

In certain ways, this market has behaved a bit strangely for some time now.  At the 1374 swing high, momentum was extremely strong, and normally we'd have expected to see a bearish divergence (new price highs and dying momentum) before prices headed markedly lower.  However, the "new normal" seems to be that the market often reverses on a dime with little in the way of the usual divergences.  I can only assume that the deep uncertainty facing the world and the never-ending central bank intervention are both factors in this ongoing (historically) unusual and volatile market behavior.

Let's discuss the market's options from here.

For some time, I'd been favoring the view that the decline was corrective and would lead to new swing highs -- but by Thursday, I began to experience some doubt in the bullish count, largely due to the depth of the retracement.  Normally, a b-wave will not retrace this deeply (as seen on the INDU anyway) unless it's part of a flat correction.  In fact, the INDU retraced more than 90% of the last rally leg, and this suggests the decline, at least in INDU, is part of a flat correction (or a new bearish leg down -- more on this later). 

In any case, a flat correction doesn't work for the second portion of a double-zigzag, because, well, then it wouldn't be a "double" zigzag, since a zigzag and a flat are two different animals.  A zigzag is a sharp correction and a flat is, well, flat.  (See how self-explanatory this stuff is?)

However, there is another Elliott Wave pattern that is very similar in purpose and intention to a double zigzag, called a "double three."  The "purpose and intention" of a double-zigzag or a double-three is to kill time and stretch out a correction longer, and usually higher.  This serves to burn off extreme sentiment levels and shift participants to the wrong side of sentiment -- i.e- to make them either more bullish or more bearish, depending on the direction of the larger trend. 

A double three is any two three-wave corrections strung together by an X-wave (another three-wave move, but in the opposite direction), and in that case, one three can be a zigzag and the other can be any of several different three-wave patterns, including a flat.  All this to say:  I think we have to consider that possibility for INDU, and the target for INDU (under these terms) would be roughly 13,000.  SPX still allows for a double zigzag.

Further, the depth of INDU's retracement does force us, in the interest of prudence, to continue at least considering and allowing for the more immediately bearish possibility as an alternate count.  The S&P 500 did traverse slightly beneath my "ideal" 1333 target, but slight overthrow is not unusual -- and the bullish count again appears to be the higher probability.  The bearish alternate count would be invalidated with any trade above the July swing highs.

This market may actually become more challenging going forward, because it is still trading in a large range, and strange things can and do happen in trading ranges.  In trading ranges, short-time-frame bullish and bearish patterns often take shape and become active, but then fail to reach their targets.  I think traders should remain very nimble until the market breaks out of this range.  I've used the Russell 2000 (RUT) chart to illustrate this.

These types of ranges can be very challenging to trade profitably, and if one doesn't take profits quickly, the ongoing price overlaps can nickel and dime one's account to death.  A range like this suggests the market is coiling and building up potential energy for a large and sustained directional move, to be launched at some point in the future.


Looking at the shorter-term picture, the strength of Friday's rally has seemingly added confidence to the bullish count.  Again however, due to the depth of the prior retrace, we need to continue considering the bearish alternate count, which would see the rebound as part of a three-leg move, as opposed to the beginning of a five-leg move.  The bearish alternate could still see higher highs over the short term, but that count should not break the 1374 swing high. 

Both short-term counts continue to expect new lows for the intermediate term.


On the short term chart, the rally is far more ambiguous than many technicians seem to think -- but, as a whole, appears impulsive.  What gives me pause is that it could still be counted as an ABC (hence the black "or 2" label), and I don't think bulls should get over-confident here.  Assuming the rally is impulsive, it's also a bit ambiguous how much (if any) farther the current leg has to run before correcting -- it could start correcting directly on Monday, in which case a retrace to S1 or S2 would not be unusual... or it could run-on more or less straight to 1390 without much in the way of corrections, much like the move from 1313 to 1374. Given what's available to work with in the charts, I am hesitant to try to outline a short-term path ahead of time for Monday, lest readers put too much faith in it.

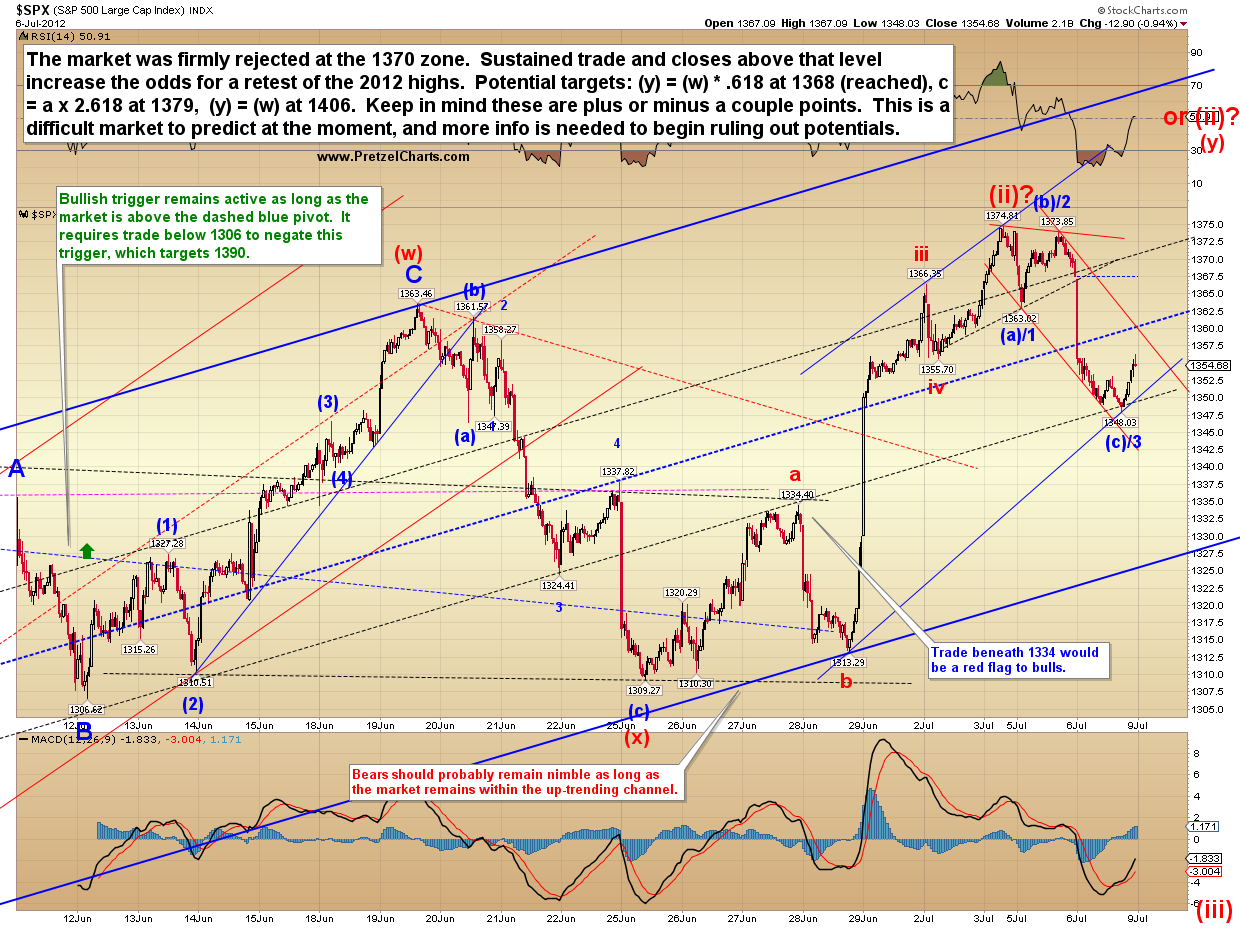
The key near-term pivots are outlined.  Further, if bulls can reclaim 1363, there's not much short term resistance until the prior swing highs.  Long-term resistance is still the 2011 high, near 1370.  Conversely, if the bears can sustain trade beneath the key bearish pivot, it will almost certainly spell more immediate trouble for the market.  The market closed Friday right at the key bullish pivot, and it remains to be seen how the market will respond to this level.


There are numerous reasons that, at this moment anyway, I remain highly skeptical in the long-term prospects for this rally, and one of these reasons is shown below.  The up volume to down volume ratio suggests limited commitment from bulls at the recent lows.  I also referenced this same indicator on July 2.  The level of accumulation taking place recently remains historically minimal.

Keep in mind that since this chart represents a volume ratio, it is relative to the total volume of any given day.


In conclusion, I am again marginally in favor of the market forming one more swing high before a sustained directional move, but it's not as clear-cut as I would like -- and I strongly suggest that traders remain nimble and protect profits as long as this market stays range-bound.  Trade safe.

Reprinted by permission, copyright 2012 Minyanville Media, Inc.

Friday, July 13, 2012

SPX, INDU, BKX: Sifting Through the Minutiae

Bears have a real shot at claiming complete control over this market.  Since March, I've stated that I believe bears control the intermediate term, but lately the short term has remained a bit cloudy.  I've sifted through a lot of one minute and five minute charts recently, and I've come to the conclusion that one more swing low will probably put the bears completely in control.  Nowhere is this more evident than in the Dow (INDU).

While SPX is a bit ambiguous, and can be counted as a correction or an ugly impulse, the Dow is almost certainly only a 3-wave decline thus far (a correction).  One more new swing low should do it for the bear case, though, and give the bears the "all-clear" signal that no new highs are coming.  Ideally for the bear case, a new low would be made beneath 12450.

If they can't make a new swing low, it would appear the bulls are still in control.


The Philadelphia Bank Index (BKX) also shows a pattern that's of some interest.  It's interesting because there are two short-term outcomes that are diametrically opposed to each other: the pattern is either basing, or about to drop rapidly (I used the term "crash" on the chart -- I mean that a bit loosely).  But there's not much in the way of an "in-between" here. 

The chart also shows why it's difficult to completely rule out the potential of a new swing high.  If the second ABC is complete, it is entirely out of balance with the first portion of the pattern.


The short-term SPX chart leaves a lot to be desired.  I'm not happy with the labeling on this chart, and I feel like -- if this is an impulse decline -- then something is off on the labeling here.  It works fine for the (a) (b) (c), but it doesn't feel right for the attempted impulse labeling (the 1-2-3-4-5 part).  Maybe that's because it's not impulsive (?).  In any case, I need to see the market's next move to figure out what needs to be tweaked (if anything).

Note that the market is close to reclaiming the blue channel.


I also took a crack at the very short-term SPX chart, and again, I'm not completely thrilled with the labeling.  My best guess is that an expanded flat is playing out.  If the expanded flat is in play, I'd expect a small bounce at the open, then a trip down to 1331-32.  However, the expanded flat isn't confirmed unless the a-wave low is broken -- barring that, it could be a standard flat that completed at Thursday's close.  Either version of a flat suggests higher prices to come.  Several targets are listed, contingent on market trigger points.


The intermediate outlook is unchanged.  The primary lingering question is still whether there will be a new swing high or whether the bulls are out of options.


In conclusion, the bulls are skating the razor's edge right now, and new lows from here will almost certainly shift all the odds firmly into the bears' corner.  If this is the B-wave I've been looking for, it pretty much needs to bottom right here.  Trade safe.

Reprinted by permission, copyright 2012 Minyanville Media, Inc.

Thursday, July 12, 2012

SPX and INDU: Bulls on Thin Ice


Yesterday's target of 1333 was hit perfectly, and the market generated a bounce... however, the bounce did not look impulsive -- as of the Wednesday's close, anyway.  This is suggestive that there will be a retest of the low, or perhaps a new low to follow. 

Quite frankly, the bulls are walking on thin ice here.  After reviewing a lot of indices tonight, I'm now equally split on the odds for the bull and bear counts.  There is still a little bit of room for the bull count -- however, the INDU broke down below its rising support line, and the bulls are running out of real estate. 

There are also potential sell triggers lining up across the board.  The invalidation levels are getting close, though I have this irrational fear of this being wave c of a huge expanded flat -- which means it would invalidate the bull count as shown, and then rally up to new highs.  Let's not worry about that yet, though.


The SPX chart suggests there may still be a retest and/or new low in the cards, but there are a lot of indications that the market should bounce from within this general vicinity.  The shape of the bounce should tell us a great deal. 

The decline still currently counts better as a 3-wave form, but there are ways to view it bearishly.  Quite frankly, I have a very hard time seeing the most recent leg of the decline (from 1361) as any type of a third wave.  It's been far too mild... thus, if the bears have any hope, they have to see it as either a fifth wave, or another first wave.  It works fine for the bull count, though technically c-waves are also third waves, they aren't always as strong as the true third wave in a larger impulse.


In conclusion, the bull count still has some potential, but bulls will need to pull things together awfully fast at this stage to make it work.  Keep in mind that if a half-way decent bottom (or top) is going to form, it will do it's best to get you on the wrong side of the trade.  Trade safe.

Wednesday, July 11, 2012

SPX Update: Market Reaches Critical Decision Point

Yesterday, I took an educated guess at the short-term path the market would follow, and, a little bit to my surprise, it followed the path I laid out almost perfectly.  It's now decision time for this market.  I continue to feel that a new high above 1374 would fit the pattern better -- and there are some signs that the bulls still have control of this market.  The decline did not come close to matching the furor of the last rally leg, and has been quite orderly.  This fits the pattern of a corrective B-wave decline. 

The market has nearly reached the lower boundary of the trend channel, and this is where bulls need to make a stand and turn things around if they want to maintain their hopes for new swing highs.  If the market fails to bounce here, we could start to see some real fireworks from the bears.

I find it interesting that the charts have reached an inflection point just in time for the release of the Fed minutes on Wednesday.  One could see things going either way with that news release (and with the charts) -- lots of QE talk could provide the thrust for that last high; lots of QE opposition could provide the thrust for an actual 3rd wave decline.  In fact, I recall that the Fed minutes, and perceived lack of support for a new QE program, seemed to be a factor near the last cyclical market high.

Funny how that works, though -- the charts are clearly approaching a decision point... and once again, it lines right up with potential "game changer" news.  It is also interesting that the pattern is ambiguous enough to allow for either outcome.

For the short-term, the pattern would look best with a slightly lower low, followed by a solid bounce.  The lower low isn't required to complete the pattern, however -- but the ideal target for the decline (assuming it isn't the more bearish alternate count) would be roughly 1333, which also "just happens" to line up with the lower blue trendline.

Another factor which favors the bulls is the strength of the rally vs. the strength of the decline.  Note how much more headway the bulls made in a few days than the bears did -- this suggests the bulls still have firepower.  However, sustained trade beneath the blue trendline would begin to shift the odds in favor of the more bearish alternate count. 


Regardless of which short-term resolution the market has planned, the intermediate picture currently only has one preferred outcome, and that is for the market to head into the 1100's.  It would literally take a moon-shot from the market, right here and now, to change this pattern into something bullish -- and that currently appears to be very low probability.


For contrast, the bigger picture chart below has been labeled with the alternate count, and also outlines a very bearish pending sell trigger.


In conclusion, the overall pattern would still look better with a new high above 1374, the first target for which is 1375-1380.  In a perfect world, I'd actually like to see a new high that slightly overthrows the upper line of the bearish rising wedge shown in the chart above.  However, the market has reached a critical inflection point now, and the bulls do need to turn this market fairly quickly to maintain their short-term hopes.  Trade safe.

Reprinted by permission, copyright 2012 Minyanville Media, Inc.

Tuesday, July 10, 2012

SPX and RUT: The Yuck Market


This remains a yuck market.  While one could get lucky and guess exactly right about what's coming next here, I don't think this market is at all clear-cut at the moment.  In my opinion, the majority of Elliotticians tend to advance wave degrees too quickly and declare corrections (or impulses) over too soon.  If they're bearish, they'll tend to be early on tops and assume the next big wave down has started (I am sometimes guilty of this myself) -- if they're bullish, they'll tend to do the opposite. 

Some Elliotticians have assumed that wave (iii) down has started already, and I continue to accept that this is indeed possible -- but I feel it's less likely, again based on the best evidence provided by other indicators.  As always, it's all about probabilities... so 60% probabilities will still be wrong 4 out of 10 times, and a strong break could always show up tomorrow -- but on Friday I warned that I felt the market was entering a chop zone, and so far that's been the case.  Unless it breaks down strongly here, I currently see limited evidence for a higher degree third wave decline yet.

The first chart I'd like to call attention to is the RUT, which again argues for a choppy correction to be followed by new highs.  While SPX presents more clearly as a double-zigzag series of ABC's, RUT looks more like a nested (1) (2) series that's in the process of forming wave C.  It could still be a double zigzag, but going with the "trade what you see" philosophy, I don't think the double zigzag works as well.

What I especially like about the RUT chart is the clarity of the invalidation level for a fourth wave decline, although keep in mind that this would not invalidate a double zigzag.  Bears should watch for a clean break of the rising trendline as a possible sell signal, since most double zigzags will maintain a pretty clean channel.

Whether one calls the RUT pattern a double zigzag or a nested C wave, it is darn near impossible to view the upwards movement as complete.  The only way that becomes possible is if one views the first 3-wave-looking structure as a really ugly A wave with an extended fifth.  Again -- always possible... I'm just working off the probabilities here.  Also note the gap open off the 820 high that gives bulls a target to aim at.


The next chart is the SPX, which could follow a similar path.  The complexity of the correction in RUT and SPX isn't required to play out as illustrated, this is simply a SWAG (an educated guess) as to how things might play out.  R2 is key resistance on SPX, and sustained trade above 1363/64 would favor the odds of a new high being made more directly.


In conclusion, the odds favor further chop with an eventual upwards resolution, to be followed by a major turn lower.  Barring that, a strong breakdown of the upward-sloping channel would shift things more immediately into the bears' favor.  Trade safe.

Reprinted by permission, copyright 2012 Minyanville Media, Inc.

Sunday, July 8, 2012

SPX, INDU, and GOLD: Still in the Chop Zone, but a Turn is Expected Soon

Heading into Friday there were several options on the table, and it appears that the favored option of an expanded flat (as illustrated on the Dow Industrials (INDU) and S&P 500) may have been the option that played out.  The second target of 12715 was reached and very slightly broken. 

Nobody likes an unclear market, least of all me (it means I have to draw extra charts!), but that's exactly what this is -- at least for the short term.

Based on the current big picture charts, I continue to favor the view that an intermediate trend change occurred near 1422 and that the trend is now down.  The S&P 500 (SPX) was able to briefly trade and close above the key 1370 level, however that came on a light holiday session and was reversed immediately.

Last week, we discussed a number of signs that the market may be topping, including the McClellan Oscillator (NYMO -- which reached an extreme overbought level), and the up volume/down volume ratio on the NYSE, which suggested very minimal buying interest at the recent swing low.  We have also discussed some signals which suggest that the market could still form a higher high -- such as the Advance/Decline momentum, and the Relative Strength Index (RSI) momentum.  These messages are not really at odds with each other, because the NYMO tends to be more of an intermediate sell signal, whereas the hourly RSI tends to be more of a short-term signal.  But it does make boxing the short-term outlook a bit difficult. 

On Thursday, I noted the possibility that the top was in, and that remains entirely possible, especially after the solid down market on Friday -- but from a short-term perspective, I believe the odds still slightly favor a new high coming (call it 60% in favor).

With the short term outlook a bit sketchy, sometimes it helps to step back and view things from the 10,000 foot level... so the first chart I'd like to share is the NYSE Composite (NYA), which presents a different picture than the SPX and INDU.  With the NYA still unable to reclaim key resistance, it is difficult to be long-term bullish on this market.  An interesting difference between the NYA and SPX is the much-broader NYA shows declining peaks beneath the 2011 highs, suggesting that NYA's intermediate down-trend actually began in 2011.  A solid breakout above the upper red trendline would be the first step toward changing the outlook here.


As discussed, the market has kept its short-term options open.  I'd like to start with the Dow Industrials, since I feel the pattern is slightly more clear there.  I would expect SPX to follow a similar path. 

There is a certain amount of tolerance built into the system, and blue wave b is not required to be complete at 12703.  It would be acceptable for the market to head a bit lower before heading higher.  The broader take-away here is that the charts still suggest a new high could be made on this leg, but I currently would not expect it to break the prior cycle high of 13338.

The main thing bothering me about the idea of a new high for the indices is the fact that major turns usually come when everyone is looking for another new high.  So it would not surprise me in the slightest if the top was in already, as discussed Thursday. 


While the short-term picture on SPX remains cloudy (first chart below), the intermediate term projections have changed very little since late May (second chart below).  Again, over the short-term, a lower low and reversal would be well within acceptable tolerances for the broader count, but any trade beneath 1306 should rule out the prospect of new highs.

Short term:


Intermediate Term:


Solely for the sake of reader visualization, I have also drawn up a simple chart of one of the short-term options that is still on the table.  This isn't a prediction so much -- it's more of a warning and for trader awareness.  The possibility of an ending diagonal here is reasonable.  It could unfold similar to what is shown, but at this point, it's impossible to put a bead on it (if it even happens to begin with) because the market hasn't yet established the converging trendline boundaries.  So, take it for what it's worth -- I'm simply showing it now because I can't be there with you during every minute of the trading day.  :)


Finally, a quick update on gold, which a number of readers have asked for recently.  The wave count here is unclear, so instead of focusing on the waves, I've focused on more basic technical analysis and presented some intermediate bullish and bearish trade triggers.


In conclusion, the market is still in the "chop zone" I warned about on Friday, and its next short-term move is a bit unpredictable.  Based on the current charts, I continue to feel that the intermediate-term will bring a significant sell off once the (assumed) wave (ii) peak is in place.  This should begin sometime during the next week or so (again: assuming it hasn't already).  The outside shot for a more bullish intermediate term resolution cannot be fully discounted yet, but continues to appear much less likely based on the market's recent signals.  Trade safe.

Reprinted by permission, copyright 2012 Minyanville Media, Inc.

Friday, July 6, 2012

SPX and INDU Updates: Choppy Market Expected


NOTE: Since this was published, ES has dropped 10 points.  If this holds through the open, we can rule out the ending diagonal and the triangle.  This would leave the option of a flat, or the option that the top is in, as discussed yesterday.


There's been no material change in the outlook since yesterday (please see yesterday's article for the big picture options).   Nevertheless, I have wracked (or possibly "racked") my brain -- or what's left of it anyway -- and scoured the charts in an attempt to find some indications of short term direction.  I found some clues in the Dow Jones Industrials (INDU), and I've diagrammed a couple options and some levels so readers can have some idea of what to watch for after the open on Friday.

I believe the key clue in INDU is the new price high on Thursday, which was made by what appears to be a 3-wave rally.  This is highly suggestive that the final high isn't in yet (no guarantees, of course, but odds favor this), though there are a couple paths the market might take to get there.  I've sketched the two most likely short-term paths into the chart below.  Both suggest the final high isn't in yet. 

Note the perfect mini-fractal of an expanded flat (in the red box). 


The S&P 500 (SPX) is trickier, because it's left the option of a triangle on the table -- however, the INDU suggests the triangle is less likely, since the two usually track in a similar fashion.  Thus, the two most likley paths for SPX are the same as INDU.


I've diagrammed the SPX diagonal on a separate chart (below).  The ending diagonal may have one, or two, more swing highs left in it: it's a bit unclear, but the pattern suggests two.


In conclusion, it appears that we may be in for some sideways chop for the next session or three.  There are suggestions that the final highs are not in yet, but also suggestions that the rally is nearing a top of some kind, and a forthcoming larger correction.  If this short-term outlook is correct, this is the type of market that can ground up short-term traders who are looking for a trending wave, and this can be very damaging to one's account.  Hopefully, the options outlined will help keep readers from getting ground up in the expected chop.  Trade safe.

Reprinted by permission, copyright 2012 Minyanville Media, Inc.