Amazon

Monday, September 19, 2022

SPX Update: Little Hope for Bulls

Not much happened on Friday, so there's still no change to the outlook

Near-term, the market still has options that could delay the inevitable bearish resolution of this pattern, but there isn't much to suggest any meaningful hope for intermediate or long-term bulls.  In my opinion, this bear market still has a long way to go.

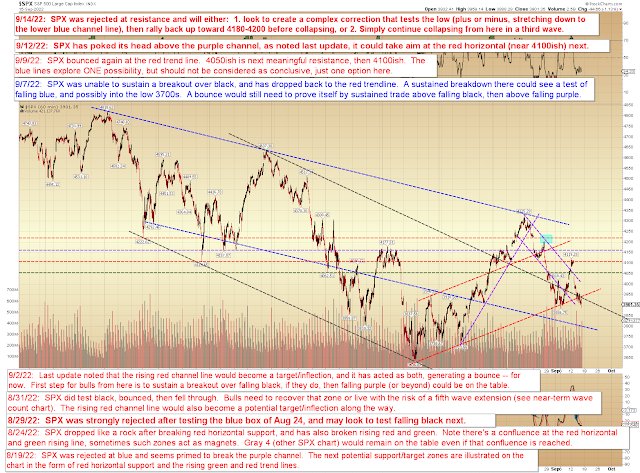
As we can see on the chart below, SPX is into a near-term inflection zone:


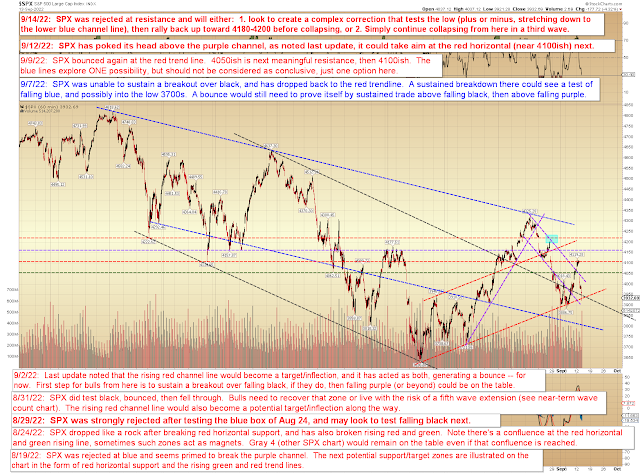
The count that would allow bulls a near-term reprieve is shown in black on the chart below.  There's simply no way to predict complex corrections, though, so the market may just ignore that option if it so chooses:


In conclusion, while bulls might find a near-term respite if they can manage a complex correction, there isn't much meaningful bullish hope that can be drawn from the current charts.  Big picture, if we are indeed entering a third wave, the market could be setting itself up for a classic October crash.  Trade safe.

Friday, September 16, 2022

SPX Update: No Material Change

The market continues to perform as expected, so let's get right into the charts.


The simple trend line chart:


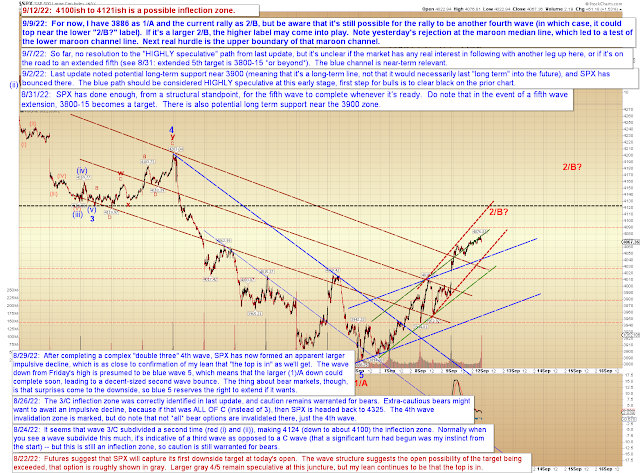
And no change to the intermediate chart:


In conclusion, the market has a couple ways it could delay the (what I view as) inevitable resolution, but I remain long-term bearish, as I have virtually all year.  Trade safe.

Wednesday, September 14, 2022

SPX Update: Market Rejected from Noted Inflection Zone

Last update indicated 4100-4121 as a possible inflection zone that could complete the rally, and the market was strongly rejected from that zone.  In fact, INDU has already made a new low:


As I see it, SPX basically has two possibilities:  Collapse now or collapse later.


On this next chart, SPX topped directly on last update's first "2/B?" label, so I had to move it up slightly so it wouldn't be covering the peak:


In conclusion, the market does have the option for a complex correction here, but I continue to believe, as I have since August 19, that the top is in.  Be aware that the most bearish potential here is for us now to already be within a nested third wave -- and nested third waves are often "waterfall" or outright "crash" territory, so bulls should be exceptionally cautious heading forward.  Trade safe.

Monday, September 12, 2022

SPX Update: No Material Change

Not much to add since last update, so let's get right into the charts:


From a wave perspective, this could still be a second wave or a lower degree fourth wave (the fourth wave stays on the table until SPX price overlaps the thick black horizontal on the chart below).


In conclusion, last update noted that if SPX could sustain a breakout of the purple channel (first chart), then 4100ish would be next resistance, and futures have already reached the cash equivalent zone, which stretches up to about 4121, so we'll see if this area offers any resistance.  Trade safe.

Friday, September 9, 2022

SPX Update: Bounce

Last update speculated that the market was in "bounce or break territory," and bounce it did, holding the support zone we'd discussed several times prior.  This creates an interesting structure wherein the current bounce could either be a large, higher-degree 2/B, or a small, lower-degree fourth wave:


On the chart above, for ease of viewing, I simply labeled both options as "2/B?"  The following chart helps illustrate how it might play if it's the lower "2/B?" on the above chart:


Now, again, please keep in mind that the above is not a "prediction" per se, it's simply one path the market could take if the current bounce is a low-degree fourth wave.  If SPX sustains a breakout over the purple trend line, then the red horizontal may come into play next, and the rally could go on to later form two legs up.

In conclusion, bulls did manage a bounce from support, but whether this is to be short-lived, or a larger corrective rally, remains to be seen.  We'll see how bulls manage the upcoming resistance zones.  Trade safe.

Wednesday, September 7, 2022

SPX Update: Bounce or Break Territory

Last update speculated that there was at least a chance bulls might put together a bounce, but also noted that the onus was on bulls to prove that with a sustained breakout over the black trend line.  There was no sustained breakout, and SPX dropped back down to prior near-term support:


This means it's unclear if SPX is intent on following the extended fifth path we've previously discussed, but if SPX were to sustain a breakdown of the noted levels, then that path would remain very much on the table:


In conclusion, SPX's intentions are unclear -- as I noted back on 9/2, the red trend line (first chart, 2nd annotation) was something of an inflection zone... and as of Tuesday's close, SPX is sitting right on that inflection zone.  So this is "bounce or break" territory, but if bulls can't get it together here, then a sustained break could take SPX down to the next noted zones.  Trade safe.

Friday, September 2, 2022

SPX and TLT Update: Next Downside Zone Captured

Last update called out the 3900 zone on one chart and a rising trendline on another, both indicated as targets and potential support zones; time and price coincided on Thursday, as the 3900 zone and the trend line were both reached concurrently, leading to a bounce.

We can see on the chart below that the next hurdle for bulls is the falling black channel line:


On the short-term chart, I've sketched in a path, but that should be considered highly-speculative at this point, as if bulls fail to clear black (on the chart above), the decline could resume in full swing:


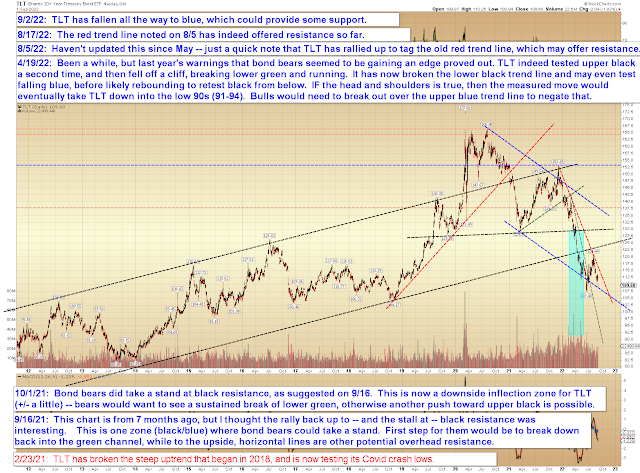
Interesting to note that TLT has reached a potential support area:


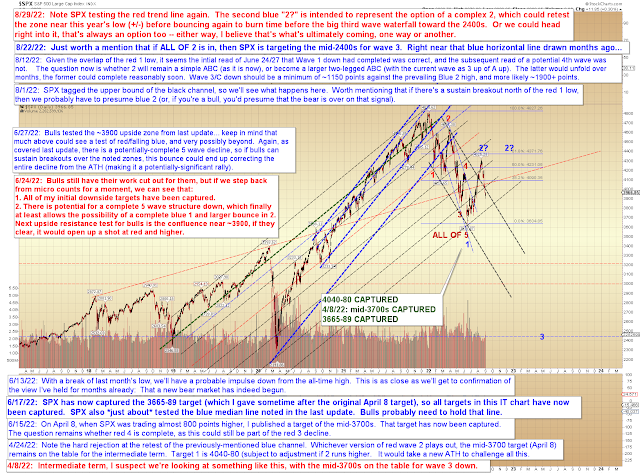
No change to the big picture:


In conclusion, last update's downside target/inflection zone was captured -- now it's up to bulls to prove they have enough firepower to generate a tradeable bounce.  If Thursday's low were to fail, then the falling blue trendline on the first chart would be on the table for the near-term.  Trade safe.