Amazon

Friday, January 11, 2013

The Pattern Repeats: Is It Really This Simple?


Last update noted that new highs were expected directly, and the market has obliged and now kicked out some key intermediate levels to the upside, suggesting the rally will continue.  There's really not much to add to the bullish expectations and projections of the last couple weeks-worth of updates, and the market continues to perform in line with my preferred bullish wave counts.  I'm anxious to see if my intermediate target of 1490 +/- from November will be reached on this leg, as it's something of a long wait between the time an intermediate projection is published and the time the market actually reaches it (or doesn't). 

There's still nothing in the charts that's screaming "sell!"  When looking at a long-term chart of the S&P 500 (SPX), we can see obvious similarities between the current pattern and the last two rallies.  While the market always reserves the right to create confusion or to have a pattern fail, the present pattern is quite bullish, and a trip into the mid-high 1500's would be an entirely reasonable result.


I'm also reprinting the zoomed-in December 2011 fractal, because I do think it's relevant.


The updated 30-minute SPX chart is shown below.  Assuming the recent rally off 1451 doesn't mutate into something more complex or unusual, it appears ready to move higher.
(continued, next page)

Thursday, January 10, 2013

Is the Rally a December 2011 Redux?


In yesterday's update, I noted that I believed the downward correction had ended at 1451, and expected higher prices directly.  The market headed up a few points yesterday, and continues to appear poised to reach new highs.  Due to the position of this wave in the big picture, it is quite possible that my short-term upside targets are too conservative, though a "standard" wave would be nearing a turn and deeper correction.  As I noted on January 2:

...this is not a rally I would look to short anytime soon.  There is massive pent-up energy in the charts, and nested third waves are not to be trifled with.  Third waves are the "point of recognition" for the masses, and tend to be strong trending waves that rarely let up for very long.  Third waves tend to peg indicators at extreme readings and stay there for much longer than seems reasonable.


I do want to briefly call attention to the similarities between the current wave and the intermediate bottom which formed in November/December 2011.  I recall that rally as being one which defied gravity, and which bears kept trying to short (myself included at times) -- and yet it ran on and on for months.  The present rally has similar hallmarks; the difference is the present rally falls in the third wave position at higher degree, and that suggests it should actually be faster and stronger than the previous wave.


In conclusion, there's little changed in the outlook of late.  So far, there are no indications of any kind of significant top.  Trade safe.

Reprinted by Permission; Copyright 2012, Minyanville Media, Inc.

Wednesday, January 9, 2013

SPX, NYA, RUT: Market Consolidates Recent Gains


Yesterday the market spent some time consolidating its recent gains.  So far, there's nothing to indicate this is anything other than a correction before the rally continues, though as discussed in prior updates, we should remain cognizant that several markets are approaching (or have reached) long-term resistance.  I’m trying to weigh that fact against the indications that this is a third wave rally -- and that means I'm unwilling to attempt to front-run a turn, and will wait for the market to lead in that regard.

To further illustrate that point, the first chart I'd like to share is the NYSE Composite (NYA) daily chart.  The long-term resistance zone is about the only thing bears have going for them here.  Since 2011, the NYA has done nothing but muscle through resistance level after resistance level.  As I've noted on many occasions since September 2012, there is just nothing bearish about this chart.  The mirroring shared between the last few months of the current rally and the first few months of the 2011 mini-crash is interesting.


Next, I'd like to update the Russell 2000 (RUT) chart, which I last published on December 19.  I noted then that I felt the pattern was intermediate bullish no matter how you sliced it, and RUT has now reached the lower edge of my previously-published target zone.  It does still appear to have farther to run, and I've outlined one potential path in blue.  I continue to believe RUT will act as a pretty decent litmus test for the rest of the market, and if it can claim the 902 level that's mentioned on the chart, it's going to be a bit more challenging to find much in the way of long-term bearish options for this pattern.


Finally, the update for the S&P 500 (SPX), which presently looks like it completed a small ABC to wrap-up red wave 4.  Back below 1451 would open up the potential of a deeper correction, with the first target being 1440-1445.

Again, there's presently nothing to be bearish about in this chart, and this simply isn't the type of wave where I'm eager to try and front-run a turn -- third waves can run on much longer than one thinks is reasonable.  If the market gives some signs of turning lower, and starts looking impulsive to the downside, then I'll discuss more bearish potentials. (continued, next page)

Tuesday, January 8, 2013

The Importance of the Market's Current Inflection Point


Friday's update noted that the market was approaching an inflection point, but expected that the S&P 500 (SPX) had at least one more fourth wave correction and fifth wave higher still to come, which the market fulfilled.  The short-term charts are in a bit of flux at the moment; so I'll discuss the short-term later, but want to focus on the long-term in this update.  In most recent updates, I've focused on the long-term bull potential, which I'm still favoring.  I should probably make it clear that I'm not suddenly flipping to the bear side here, but nevertheless, I do want to bring a bit more balance to that discussion.

I want to start off with a chart that does a reasonable job of highlighting the long-term importance of the current inflection point.  The Philadelphia Bank Index (BKX) has broken out and back-tested a bullish basing pattern, and is now in a critical long-term resistance inflection zone.

The problem for bears is that this chart simply isn't bearish -- it has bearish potential; but it's important to understand the difference. 


The chart below zooms in a bit on BKX and discusses the likely wave structures and targets.  While BKX has loved blow-off tops of late, I have to favor the more traditional market pattern, which is that the strongest waves usually fall closer to the middle of the pattern -- thus suggesting further upside is still out there after the next correction.


The Nasdaq 100 (NDX) also continues to highlight how critical the current zone is for bears to defend. (continued, next page)

Friday, January 4, 2013

Do Not Feed the Bears


Last update expected higher prices, and the SPX rallied up to break 1464, which puts a big dent in the straightforward bear counts (which, for new readers, I have not favored) -- nevertheless, this weekend, I'm going to cover the bear case in more detail.

First, a quick picture of my new favorite t-shirt.  I've been bullish on the market for the last few months, because that's where the technical picture took me.  But I'm still a bear at heart.


I'll briefly touch upon the bear case today, starting with a chart of the Nasdaq 100 (NDX), which features a much cleaner structure than many other indices, and does suggest that the market is approaching another inflection point.  Inflection points are not necessarily bad news, but they are areas where trend changes have a higher probability than usual.  The NDX chart notes some details, including a typo -- it should read "2598 is critical support"(!).


Next is the S&P 500 (SPX) preferred count, which still sees higher prices -- though, here as well, a correction may be drawing near.  Note there are two different bullish ways to view the rally structure.  My preferred interpretation is shown below, another option is shown on the hourly SPX chart.  Of course, the bearish ABC can't be fully ruled out yet (noted below). 


It's also possible to view the rally as a deeper nest of first and second waves.  The entire correction is quite unorthodox, and thus it's pretty open how you want to view it.  It's something of a moot point at this moment, as both interpretations ultimately point higher. (continued, next page)

Thursday, January 3, 2013

SPX, NDX, BKX, INDU: Charts and Fundamentals; Why the Rally Should Have Legs


Last update noted that probabilities favor that this rally leg since November is only half-way complete. I continue to favor that view. Yesterday performed as expected for a nested third wave rally, and the bear count (which I’ve discounted since October) is very close to being invalidated once and for all. Trade above SPX 1474 would accomplish that.

This market has an awful lot of bullish potential, but what can bears do to put an end to it all? In this update, we'll cover, in brief, some key signals and price points to watch going forward. There is also one important fundamental factor, which suggests more rally fuel, which I’ll cover later.

The first chart I'd like to share is the Philadelphia Bank Index (BKX) which, as long-time readers know, I believe has acted as a critical "tell" over the past months. BKX has finally vindicated my view that the November low was, in fact, an intermediate bottom, and that the decline into that low was corrective. The chart below is the daily BKX and covers the two most likely wave counts.

(If you’re new to Elliott Wave Theory and don’t understand how it works, you may want to review my article on the subject: Understanding Elliott Wave Theory, Part I)

As noted on the chart, the first bearish option isn't particularly bearish, at least over the intermediate term. The first bearish option would see this as a three-wave rally, which could complete after another small leg up or two, then a large correction (50-62%), followed by another new high.

The bullish count is exceedingly bullish, and, without any present evidence to the contrary, I am left to continue favoring that count. Currently, the bullish potential is such that one probably simply wants to chase the market higher with stops, since if this is the "nested" third wave depicted, it will only correct from time-to-time on its way higher (much like yesterday's action).


The S&P 500 (SPX) outlines the preferred bullish option, and notes some key levels. The bears' final hope here is that the wave I'm viewing as wave 3 is actually wave C of an ABC correction (shown in more detail on the INDU chart which follows). Trade above 1464 would put the bear count under severe duress, and trade above 1474 would finally lay it to rest.


In my opinion, the Dow Jones Industrials (INDU) continues to make the bear count low probability. The pattern here is a bit harder to reconcile as an expanded flat and -- while there are always corrections along the way -- that suggests the rally will continue to have legs for the foreseeable future.  I have outlined the first two key levels bears need to reclaim in order to begin creating doubt.

(continued, next page)


Wednesday, January 2, 2013

SPX and US Dollar: Rally Likely Only Half-Way Through


Last update, the market had finally flipped me from bullish to neutral -- but I noted that the market was clearly set-up for a large directional move (in fact, I titled the article "2013 Should Come in with a Bang").  I also noted the market seemed to be waiting on the fiscal cliff resolution.

I've been pretty consistenly bullish since November, but I won't deny that by last update, the bears had shaken my faith quite a bit. They pushed the market right to the edge; however, I felt they had not yet tipped it over and that critical support had not yet been breached.

Well, now we have our resolution, and -- proving that procrastination can be a winning strategy -- Congress has managed to live up to the phrase "Necessity is the mother of invention."

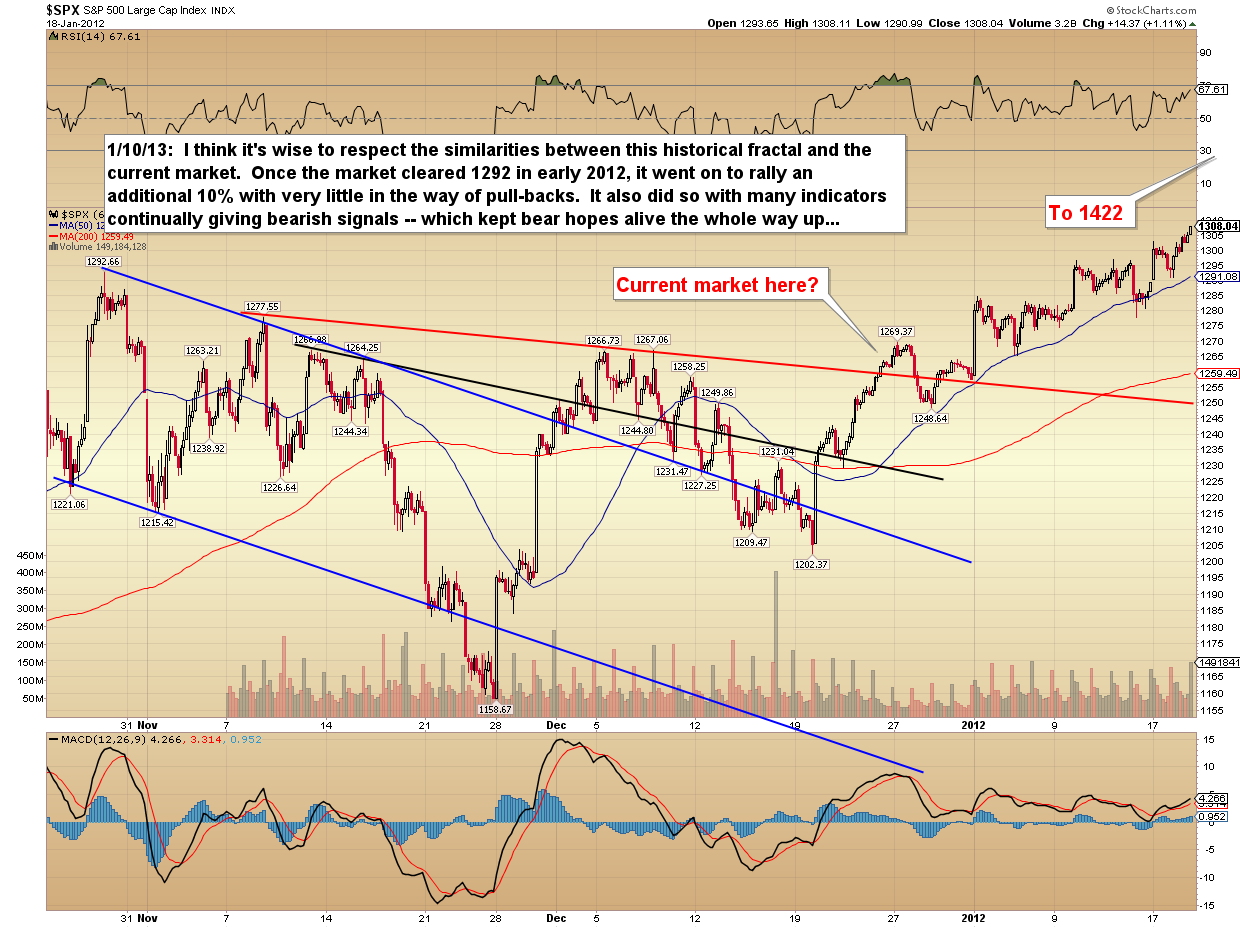
There is a very bullish set-up in the charts, and it's likely that we're only about half-way through this leg of the rally (with potentially much more to come over the long-term).  November's intermediate target of 1490 +/- seems quite likely to be reached in the next few weeks or sooner. 

As I noted in the last update, the Philadelphia Bank Index (BKX) was signaling the potential that the whole decline was complete, and overnight futures are now indicating that potential is indeed the reality. 

The short-term BKX chart, which was posted as a waypoint on Monday, is updated below:


Given where the futures are trading this morning, the bear count is likely to be invalidated directly upon the open -- and a big gap up fits the pattern of a nested third wave rally (the expectations of the pattern) therefore, I'm not inclined to update the bear count at this time.  I feel the bear count will become extremely low probability once the market trades above 1448, and that break will all-but-guarantee new highs above 1474.

At this point, it will take something completely unexpected, or a break of 1398, before I consider the bears as serious players again.


It should be noted that there is extremely bullish potential in the current market.  This appears to be a third wave rally at several wave degrees (note the red ii at the November low), which opens up potential for a preliminary long-term target of 1680ish.  There is another option, called an ending diagonal, which is less bullish, but would still see a trip into the high 1400's at the minimum.  The bottom line is that the preferred intermediate counts of the past several weeks range from "pretty bullish" to "exceedingly bullish."

I do hope my warnings recently kept bears from over-committing.  I know a lot of technicians were quite bearish of late, but I felt the bears never quite clinched the deal for a number of reasons.  And every now and then in trading, just as in life, gut instinct beats everything.  As I noted on 12/27:

Bears have a definite shot at taking control, and there are a number of signals right on the cusp of rolling into their favor -- and yet I have a gut feeling that bulls will somehow manage (yet another) stick save here. 

Last update, I published the triangle potential that I had noticed in the US dollar -- and until 78.60 is broken, that potential remains for the time being.  However, I continue to favor dollar bears for the intermediate term (either directly, or after further consolidation), and below is the preferred wave count for USD.  The first alternate is the extended sideways correction (triangle; not shown), which basically just stretches out the consolidation before ultimately heading lower.  I would rethink that outlook if bulls reclaim 81.46. (continued, next page)