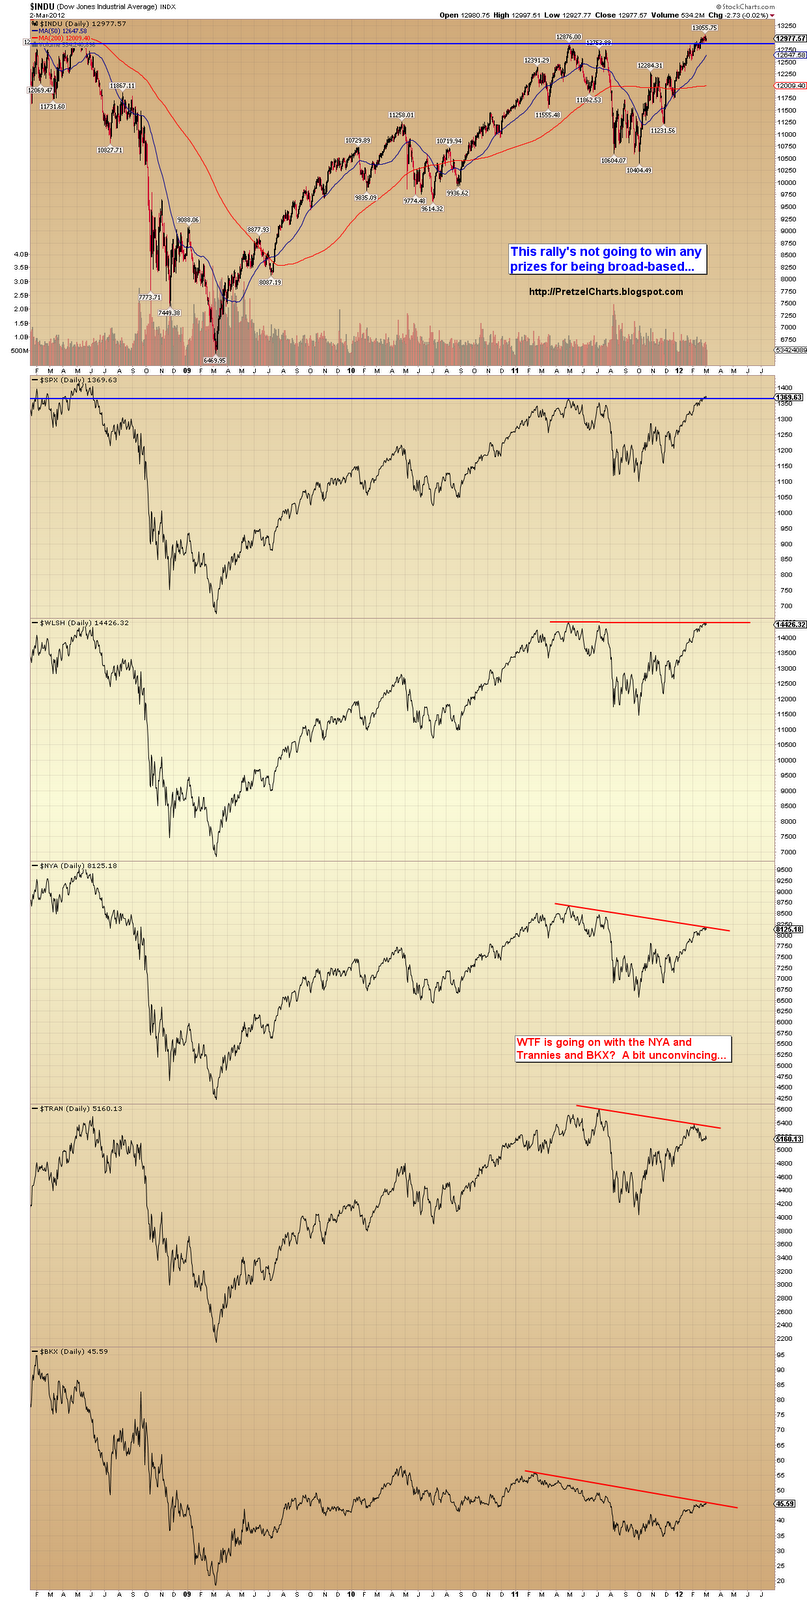
The first chart is a view from the 10,000 foot level, and shows how the rally has been pretty narrow, which isn't usually how a massive new bull market would start. A rising tide lifts all boats, as they say. If you right click and select "Open in new window" (or tab), then click the chart once to zoom, you can see the chart at full-size. This is a fairly large chart, and hard to see at Blogger's default size.
Next, a quick look at the German DAX, which is also still well off its 2011 highs. The trend seems to be weakening here as well.

Next the 10-minute SPX chart. Not much to add since Friday. This move could still have another down/up (or two) left in it -- as I said before, if it is an ending diagonal, they have a tendency to run "one more leg" than you thought. The short-term structure remains a mess.
The preferred count is still that a top of some form is now in place at the 1378 print high... but this count is only preferred by a slight margin.

Readers who aren't drinking heavily will note that the SPX violated its (assumed) 2-4 trendline in the chart above. This is the first such trendline break since Jimmy Carter was attacked by a giant swimming rabbit. Okay, maybe it hasn't been quite that long, but it feels that way.
If the 2-4 count is correct, then this break is a bearish signal. However, below is an alternate way to view the trendchannel, which is still very much intact in this view.

Next a random chart, which I'll have to upload before I can comment on it. I worked on so many charts, I don't actually remember what the point of the next one is. Oh, yeah, it's the NDX melt-up channel, and shows three potential support lines. The NDX did capture its 2650 target (on the nose!), which was mentioned a week ago.

The next chart is pretty darn cool. I was doing some work with the Dow this weekend (we built a fence in my backyard together), and I seem to have found a fairly convincing time cycle buried in the price movement. The boxes are all the exact same size, and very accurately measure the time of a move from various peaks to troughs. The blue box/cycle seems to alternate somewhat between highs and lows, but the cycle always seems to land on one or the other. The red box is clearly a low-low cycle.
Keep in mind that I didn't cheat these boxes at all -- they are all exact copies of one another, and the exact same size (well, the blue ones are all the same size as the other blue ones, and the red ones are all the same size as the other red ones. The blue ones are not the same size as the red ones. I figured I didn't need to explain that part... put the liquor away already!).
Assuming this cycle is still active (it has been since March '09), then this chart suggests a high is due very soon. I should probably keep this chart secret... but what the hell, I'm in a generous mood. Plus you probably won't remember I showed it to you anyway, with all the drinking you've been doing.

Next the big picture US Dollar. Note the gray alternate labels. The possibility of a large a-b-c still can't be ruled out.

And the intermediate dollar chart. The recent low sure has the look of an IT (intermediate term) low, and the dollar has closed back above its important trajectory level.

Next, silver. Silver could be in the early stages of a fifth wave up at Primary degree -- alternately, it could be forming a double-zigzag to new lows. In both cases, further downside appears likely over the mid-short term, though it's likely to correct upwards a bit more first -- perhaps a back-test of the red/blue trendlines.

Next the BKX, which also appears very close to finishing a complete 5-wave rally.

Next the updated RUT chart. RUT broke down from its rectangle, which was mentioned on Friday, and is now targeting 788/789. As long as RUT remains below the breakdown level (approx. 810), the target remains active.

It's also important to look at the bigger picture RUT chart, which shows major trendline support is just below the target area. If you took that breakdown trade, it seems ill-advised to get too greedy after the target is reached -- assuming it is reached, of course.

In conclusion, the red boxes are not the same size as the blue boxes!
Also, it still appears likely that a correction is due in the near future -- the question is whether it's already started, or whether there's more upside coming first. Again, because of the ambiguity of the wave structure at the start of this rally, and the ambiguity in the short term structure right now, there are still several possiblities for the ending -- and for that reason, I suggest traders pay close attention to the support and resistance levels and the trend channels. There is a lot of evidence which seem to support the conclusion that this is a fifth wave -- but this rally has surprised us before. So trade safe.
The original article, and many more, can be found at http://PretzelCharts.blogspot.com
I would say good morning, but it's still before midnight here... :)
ReplyDeleteHmm. Arf-ly quiet at this wee hour. Imma take a break from the computer for a bit.
ReplyDeleteMorning PL - great work. Each day is another small step up the learning curve.
ReplyDeleteJust scalping the small moves here, 7 round-trips so far.
ReplyDeletethe last five times that food prices have advanced more than 7.5% on a YOY basis a recession has followed.”s $DBA http://bit.ly/A0nUW7
ReplyDeletehttp://www.mmacycles.com/weekly-preview/mma-comments-for-the-week/mma-comments-for-the-week-beginning-march-5,-2012/
ReplyDeleteGoog morning PL. Thank you for your beautiful work and great effort.
ReplyDeleteHere we are at 60-2 ES area, as my young son mistakenly said one day, 'same shirt, different day.' A couple of possibilities, watch $VIX and dollar for clues.
ReplyDeletehttp://screencast.com/t/POpbMCCtoq
Wow. PL you've out done yourself. This is a chartapoolaza of a post with excellent comments calling out important levels.
ReplyDeleteLOL at " This is the first such trendline break since Jimmy Carter was attacked by a giant swimming rabbit." It sure does feel that way.
Good luck everybody!
X1-class solar flare today. http://pic.twitter.com/bmGHyyVd
ReplyDeleteCME from today's X1-class solar flare to reach Earth MAR 8-9. http://pic.twitter.com/gQY9YkuE
ReplyDeleteThank you for all your information. It is all good.
ReplyDeleteJoe
My retrace level has moved down from 69-71 (last thread) to 68. Above that and another trip to the top triangle TL.
ReplyDeleteThanks for all the work you put in PL. It is greatly appreciated.
ReplyDeleteHappy Fibonacci Birthdays. Today: Fibonacci 8th birthday of the 2004 "A" wave top. Tomorrow: Fibonacci 3rd birthday of 2009 cyclical low
ReplyDeleteThanks for the excellent road map PL. Your labor of love makes all of us better "market players". Question: who is Jimmy Carter - a Disney character?
ReplyDeletePL, there isn't an "incredible post" button, so I am posting a comment that this post is incredible. Great stuff.
ReplyDeleteI feel like I'm being lied to. Those red boxes are most definitely NOT the same size as the blue boxes!!
ReplyDeleteMe thinks your cowbell runnith over :)
ReplyDeleteOn the Dow cycles, que Spock, "Fascinating"
The boxes are all the exact same size
ReplyDeleteBS, have you tried Wave 59?
ReplyDeleteYeah baby
ReplyDeletePL,
ReplyDeleteGreat work...still! I have read the post many times and I still can't find the kitchen sink chart! You know the one. It's where the red, blue and orange boxes are all the same size....and color.
does anyone has trading plans for today...? entry and exit levels.. s+p and ndx futures..
ReplyDelete10 am will be ISM and factory orders....
Surely is best to wait.
Cheers
if the flip the chart 180 degrees, the color of the boxes become very clear
ReplyDeleteyesterday was the sp500 55th birthday.
ReplyDeleteSold TVIX 16.51 sold TZA 20.30 Bought XIV 8.96.
ReplyDeleteTvix has opening gap.. i'll back around there..
ReplyDeleteMy limit order at es 67 got filled, am now short. sl at 68.75, may go long if it holds up there.
ReplyDeletethks
ReplyDeleteIsm and factory orders seems to be non event...
covered at 60.5
ReplyDeletelook at the chart / comments Katzo posted earlier - 60-62 is support, 66-68 is resistance.
ReplyDelete'nother test of 60 es
ReplyDeleteand a break
ReplyDeletenice 5 wave down. 3 wave up correction to come?
ReplyDeletespx lower low, but not dow. After the break of 60, what is the next target if more downside?
ReplyDeleteThe low comments given the down day is surprising. Maybe the bears are tired of being run over? Here's some bear food from John Hussman and John Mauldin:
ReplyDeletehttp://hussmanfunds.com/wmc/wmc120305.htm
http://www.johnmauldin.com/frontlinethoughts/unintended-consequences1
AAPL down big (9 points), may form Island Reversal
ReplyDeleteGap down I called for on Friday happened I guess.
ST ES tgts, I wish the eur/$$ would participate on the downside, looking for that to catch up tho
ReplyDeleteT1 37.5
T2 34
T3 51
Below 1360 and we are below the lower blue rising trend line of PL's second (more bullish) spx chart. We were already below the lower TL of the first chart. If we can close below 1360, will give more credence to last week's key reversal day.
ReplyDeleteNDX 2630 narrowing funnel broken & approaching 2600 w/2605.81. your meaning of "black upper" in box on NDX chart? why not more labeling of short term spx labeling tonight?
ReplyDeleteWas just gonna ask you about that. I was watching the 1 minute chart but need to look at other time frames. Do you have any targets you are looking at? Thanks again for you contributions here.
ReplyDeleteAll components of SPY are down, except XLP (consumer staple). One sign of risk off. :)
ReplyDeleteeur/$$ not cooperating, will push out the next drop some imo
ReplyDeleteLooks like there was a Apple mini flash crash just few min ago
ReplyDeleteAny comments are appreciated.
ReplyDeleteChart did not post.
ReplyDeleteINFN......going to stay with my INFN buy even though I have a mental stop at $7.70. Wave four is not suppose to overlap the wave 1 high, but perhaps this is a very bullish 1-2..1-2 (cross my fingers and hope to die). Down 50 cents (6%) and maybe that's what I get for going long when everything is saying the markets topped.
ReplyDeletePretzel, you went all out dude! WOW what a post. You cracked me up, while there was a ton of info to adsorb. I need to re-read this like 10x.
ReplyDeleteSince I am color blind, which are the blue and which are the red boxes???? ;-)... no seriously I am color blind! Looks like SPX is (finally) trading outside the 2+month old trend channel. Not that I care much if markets go up or down, really. I care that the markets behave a little more normal (I know they never be completely normal ;-) ). And today's action, or actually starting last week, was more normal. The meltup since Dec 20 (and Oct 30 for that matter) was not normal. And that was frustrating, even when going long. Most major markets are now testing their 20d-SMA averages, which often tend to be (intermediate) support levels. We'll have to see how they hold up (DJI is trading below that level now...)!
AAPL shaking the tree to get rid of some bad apples to be able to continue it's uptrend, or is their now a worm crawling under it's perfect shiny skin????
sideways til eur/$$ makes up its mind. . . . 62-3 ES should cap all action, if not (?)
ReplyDeletetgts on AAPL?
ReplyDeleteDetailed analysis on the Hussman article. Thanks.
ReplyDeleteI was just looking at some support targets for AAPl in the above 5 min charts. Wondered if you had anything different you were looking at.
ReplyDeletethank you much katzo7
ReplyDeleteI believe this is basically back testing of the 60-62 area, may be a lengthy one, that is why I said over 63 would put a ? in my mind. eur/$$ is in a downward channel, we have to believe that [see prev. posted chart], so today is an anomaly as far as eur/$$ & $SPX correlation, basically imo it will take time to continue downwards motion, $SPX etc.
ReplyDeletesold XIV 9.03 bought Tvix 16.45. will try one this for a while
ReplyDeletethe EURO anomaly might have been due to the fact that it dropped big last week while the spx didn't? so it is just playing catch up with one another today?? just a thought
ReplyDeleteI corrected the ST ES tgts found below, add .75 for $SPX
ReplyDeleteWhile digging through the Hussman archives I found this nugget on Club Med. Everyone is predicting a Greek default, but I have been wondering what a nation does to recover after that step. This paragraph at least touches on the subject:
ReplyDelete"The only real option for Europe is to allow peripheral defaults; to
allow distressed and insolvent countries to exit the euro; and then for
those countries to redenominate their own national currencies and peg
them to the euro at a gradually depreciated level (which would be best
for their citizens and could plausibly improve their competitiveness
enough to close their primary deficits). At the same time, the proper
way to avoid European contagion is to restrict the "ring fence" to
Europe's more solvent and fiscally stable member countries."
http://hussmanfunds.com/wmc/wmc111003.htm
agree
ReplyDeleteVZ up while market down. at HOD. Very similar to 2011 fear hedge against long positions and nice dividend
ReplyDeleteSOXS big move up.....semis are weakest today it seems. to continue down it seems that we need VIX to run past 20 soon and RUT to break down and close comfortably under 800?
ReplyDeletepossibility it goes down hard now. . .
ReplyDeleteI'm making a phone call for the VIX increase.. I'm on hold..
ReplyDeleteyou dial the right number? lol
ReplyDeletehttp://www.marketwatch.com/story/best-hedge-now-volatility-2012-03-02?siteid=yhoof2
ReplyDeleteif euro sells off we should spike down i wud think but i hvnt traded EUO and UUP in a while now......great time with them last summer tho
ReplyDeleteBollinger bands on TVIX is as tight as ive seen it.. 60 min chart is defined well. wont be long for a big move in one direction (imo) . not trading advise. just observation.. disclosure. in currently long at 16.45
ReplyDeletei got thru.. :) ..but the call canter was in Guatemala so it was broken Ingles..
ReplyDeleteawesome thanks
ReplyDeleteTVIX just jumped out of nowhere. Your xiv/tvix strategy is working out well.
ReplyDeletei pushed the "easy" button :) thanks.. the hard part is selling as it waterfalls after most small increases.. short term.. we havent seen a Big one yet.. the short squeeze at some point will be interesting.. imo
ReplyDeletethanks for the info
ReplyDeletewas the hold music 'more cowbell'?
ReplyDeleteNope, no hard down, think they saved it for a while, we go up now, that was the final EW5 I saw, sometimes hard to separate a hard fall from an impulsive bottom (EW5) that turns into a EW1 up
ReplyDeleteP.S. I am getting whipsawed, trades okay, short and sweet, but trying to define direction not. lol
tgt 69 to 71, if we break 63-4 ES
ReplyDeleteshould have immediately asked to speak to the Supervisor, they would be in India, with his/her Supervisor in China.
ReplyDeleteIf I have ever been shy or reluctant to post a link to an article on my own site (out or pure respect for Pretzel), this is one where I have absolutely no reservations. I know with 100% certainty that Pretzel and all of you will appreciate this one. The Hindenburg Omen is suddenly acting up, and faster than I'd expected.. I nearly got caught not paying close enough attention today. Here's an update that I hurriedly published just moments ago:
ReplyDeletehttp://albertarocks-ta-discussions.blogspot.com/2011/12/hindenburg-omen.html
In for 20 - GDX Mar 54 Puts @ $1.30 looking for resounding break of $53. Warning, this is more of an anger trade cause I missed picking up 56 Puts last Thursday due to botched entry, but believe the trade still has merit - extraordinary volume last Wednesday's debacle.
ReplyDeleteI'm just holding 900 with a stop in at 16.17, and a day limit in at 21.75 for any flash crashes (come on Katzo, do your magic...[for me] it's not worth the ag to move in and out right now with the way it moves. As soon as we get out of this contango fustercluck and its perceived premium is faded it'll possibly move a bit more "normally". The question is, can you hold it until the waterfall. It'll come...might be days or weeks (or May), but the waterfall is just a matter of time. Too much bad mojo out there for this liquidity pumped zombie to sustain itself IMO. I could be wrong...that would not be unusual. :)
ReplyDeleteThanks AR.
ReplyDeletetgt of 63 hit
ReplyDeletehmmm.... decisions... decisions.... Battleship... L 14. hit. your move
ReplyDeleteB12.... :)
ReplyDeleteout of curiosity, why 21.75 specifically? thanks
ReplyDeleteThis market just will not drop. But AAPL is down quite a lot for change.
ReplyDeleteKatzo,
ReplyDeleteTwin pipes on the ES 240 ?
Also am seeing wave 5 as potentially being completed tomorrow AM, fwiw.
This equity levitation is not supported by the FX at all. Look at AUD/USD, it did not respond to this ramp at all, something fishy..
ReplyDeleteIt would have to be a substantial waterfall, and it's more of a "tweener" between recent resistance levels of and 19.05 and 24.83 just for a ST flash event when I can't be at the computer at times during the day. It has been difficult for me accurately track how TVIX is correlating with the contango and perceived premium. Any suggestions would be greatly appreciated. :)
ReplyDeleteKatz, I tried tuning out the news and turning up some music, but I just can't DO IT! I'm addicted to news, I'm a news junkie - somebody please help me!! Maybe its my music taste that's the problem:
ReplyDeletehttp://www.youtube.com/watch?v=O7-HRBxLkrc
Did anyone realize Europe's problems went this deep?
ReplyDelete"[Spanish] Unemployment stands at an EU-high of 23.5% in February."
http://seekingalpha.com/article/412181-the-tragedy-that-is-spain
That's old news. Portugal and Greece are just as bad, if not worse.
ReplyDeleteIncredible market strength!!! :)
ReplyDeleteThis is the updated chart I posted on Saturday. It argues in favor of an additional v th wave down to complete 3 down before the bigger 4th wave retrace. What do you think?
ReplyDeleteHave a 4-year old who shouts out UP! or DOWN! as he sees green or red while he watches the Bloomberg ticker....Sponge Bob Square Pants starts to look real good after a few minutes of that. But Little Dude thoroughly enjoyed "The Sounds of Chickens." :)
ReplyDeleteI'm a novice, so I pretty much follow what the more experienced traders say. Katzo came up with some levels a few weeks ago (19, 21, 28), and pretz said he just uses the spx as a guide. I'm willing to be patient b/c I bought a crapload around 14 in late january. It seems the premium is keeping the shares up around it's 61.8 retrace from the recent spike (21-ish), and the conditions are pretty similar, maybe with worse contango.
ReplyDeleteI am an Uber Novice and you're in a most excellent position. This isn't a terrible level either. You will do well. :)
ReplyDeletei have a beagle.. every time he farts i sell
ReplyDeleteGreat stuff JB!
ReplyDeleteGot my cue this weekend that I might be a little too obsessed when my 4yo girl was drawing on some of PL's charts that I had printed out, and when her Moma asked what she was up to she said "studying the market" - awesome how the lil' chilins' mimic us. My 8yo boy claims to have a vested interest in the USD because as he says it, "its our future, what are they doing to our future"!
Damn I need to get away from this sh$+t!
Yeap. The youth unemployment is far worse. Under 24 years olds - there is around 50% unemployed and rising. A lot a adult children are living at home because they have no work/income and no prospect of moving out into their own house. I'm surprised its all dragged out this far. Just goes to show...money printing is not the answer. It only provides a sticking plaster and does not get into the real issues of their problems. Their is a crash coming...but timing wise...that's the difficult part due to the CB interventions, propping this all up. This summer is going to be interesting... more riots? War with Iran? I would not be surprised with the latter just to try to distract people away from the local problems. This will not work either. Very critical time for the markets and world peace.
ReplyDeleteWait 'til middle April to make your move. That's my strategy. I think this market will hold up until then. Starting May, the fireworks are going to begin and should provide good profit opportunity on the downside until start August (FED meeting). With all this money printing around, i'm sidelined until then.
ReplyDeleteJBG, my advice, The big crash ain't gonna happen till April. For now, just extract ST profits - measured in hours to a couple of days. It is impossible to calculate expectations using "causality math" so don't bother. I would note that there are a lot of DOJIs on the TVIX price chart. I'm using the 60-minute charts. Notice how often these Dojis are revisited. So just pick a "reasonable" short-term level for selling and put in your order. :-)
ReplyDeleteNow *that* is a system....What does he have to do to make you buy?
ReplyDeleteThis'll cheer him up.
ReplyDeletehttp://www.youtube.com/watch?v=-Yhrb2wNTD0
I enjoyed these reads. Thanks WN.
ReplyDeletelooks more like a 4th wave after we possibly finished a wave 3 down today.
ReplyDeletelol, don't try to trade the news or you will see what I am saying. . .
ReplyDeletewilling to part with the dog? lol
ReplyDeleteI have a fan in my laptop that will speed up with a big move is coming. My thinking is that my quotes window is crunching numbers.
absolutely agree, just a PITA short term respite before more down imo
ReplyDeleteno disagree, March, I could be wrong tho
ReplyDeletenotice how 63 ES held, sort of. Always have to give my levels a point or so.
ReplyDeleteIf he humps your leg, double-down and if he really gets down on it, go all in!
ReplyDeleteWhat can I say Scotty? My comment got flagged for no reason other than that in the past the trolls have flagged them and now disqus barely publishes anything I post if it contains a link.
ReplyDeleterotflmao
ReplyDeleteHad friend that had lots of rare American coins and was questioning him about his security, you know, if he planned on taking a vacation soon. Then I saw a dog dish and, somewhat startled, asked, 'do you have a dog'? He said, 'don't worry about all he would do is to lick you to death.' Is that your dog, does your dog bite?
with chart of possible count attached to clarify my response. No guarantee it's correct; I ain't pretzel ya know! ;-)
ReplyDeleteAnd on that note, I'm going into "Doom N Gloom" rehab - news free for 2 months, maybe I'll turn on CNBC for awhile!
ReplyDeleteOkay, one more from the TWITwire and that's it:
"Keynesianism always fail. The problem is that it fails slowly. Kills you more like heroin than a bullet to the head" - Jim Rickards
I see the light!
ReplyDeleteYour Pump-n-Dump penny stock example this weekend was right on - when you hear about it or read about it, forget about it
Good evening PL,
ReplyDeletea beautiful set of charts, well worth the effort, thank you.
This is my take on SPX 5th wave, showing an ending diagonal. I think.
In the INDU it is a 4th wave triangle in the same position.
If they are correct, a top (of sorts) is in, probably the end of a 3rd wave for the reason below.
If RUSS2000 is now in a 4th wave, and it looks typical, then the next wave up is going to be a doozy, and will I should think, take all the other indexes with it.
We have a glimpse into the future. Maybe.
This bull run is far from over.
Kind regards,
UKDNY
Thanks DD...you are absolutely correct...catching up on orders in my machine shop occasionally keeps me really occupied as I have to focus on keeping the work flow going and not sticking my hands in the whirly sharp things...today was one of those days that keeps me away from the screens.
ReplyDeletenow I know who you are, you are the star of Sons of Guns on TV.
ReplyDeleteI agree, and also concur with PL, that the markets most likely
ReplyDeletefinished wave 5 of III on the 29th, and most likely are now in wave IV, (which should be an A-B-C, and maybe we've just finished A today? Not sure, could also be 1 of A???). Anyway wave IV will bottom who knows where exactly, and then wave IV is still to come.
Good evening SSUSA,
ReplyDeleteLooks like a turn is in doesn't it?
My chart is unfortunately faulty (I forgot to measure it; I'm afraid 4 overlaps 1 in both indexes so...
back to the drawing board! (Looks nice though!)
4th waves tend to be flats: 3 down, 3 up, 5 down so it could be complete already.
Time will tell.
Kind regards,
UKDNY
NAS100 impulse wave down, 4 waves so far, nicely proportioned.
ReplyDeleteSPX & INDU will follow.
That would be enough to give me a twitch.
ReplyDeleteI think we'll know when wave 5 starts with a big up day or a big intra-day reversal. It won't be subdued IMHO.
ReplyDeleteNah...they're hacks...I'm a friggin artist. My machine parts are beautiful (I hate that I have to abrasive blast everything), and I guaranty that they have used my stuff...that show makes me crazy...but they make crazy money on some of their stuff, and have a lot of fun doing it, so I have to admire them.
ReplyDeleteINDU triangle? top.
ReplyDeleteCramped but legal, I think.
Dave, thank you for the 2nd donation today. :)
ReplyDeletePretzel, I love your work, but McHugh already published the rectangle chart on the Dow:
ReplyDeletehttps://www.technicalindicatorindex.com/subscribers/guest-articles/McHugh%27s%20Article%20March%20Cycle%20Turns%20March%205th%2C%202012.pdf
Guess where he got the idea?
Cheers,
cg
Where did he get the idea?
ReplyDeleteHmm. I just went and looked at it, and his is actually different than mine. At first glance, they look similar, because we both used the color blue -- but if you look past the first two rectangles, they're quite different. I suspect he "cheated" his rectangles. Also, he doesn't have the red rectangles. Btw, the red rectangles are NOT the same size as the blue rectangles, in case there was any confusion on that point.
ReplyDeleteProbably the same place I got the idea: from countless years of cycle work that's gone before us.
ReplyDeletelmao -- I know, sorry. I should have clarified that point.
ReplyDeleteWell, uh, I suggested it. Chart a cycle on the 2011 high and low, then zoom out a bit. Then zoom out some more.
ReplyDeleteOn my charting software (OX), this same cycle hits the 1987 crash, the 2002 low, the 2009 low, and many other turns along the way. It also comes due this week. I sent it to McHugh because he has one of his cool "phi mate" turns scheduled for 3/7, right in line with this cycle.
Attaching an chart of the kind of perma-bearish crap I post over at the TickerForum.
albertarocks, i hope i didnt flag on accident. i liked it and not flagged it i dont think i did, maybe PL can check? on my laptop when i scroll on pad it does weird stuff
ReplyDeleteVery interesting. I'm assuming OX refers to Option Express? Does it do time cycle searches automatically?
ReplyDeleteNice. You know, it would save me a lot of work if you guys would suggest cool stuff like that to me more often. ;)
ReplyDeleteI stumbled onto the blue rectangle cycle somewhat accidentally while I was measuring the height of certain moves in relation to each other. I use rectangles to measure height, and I happened to notice that the two copied rectangles lined up on peaks/troughs, so I started playing around with it.
It's definitely not a new "idea" -- I've seen cycles represented like this many times -- but I hadn't seen either the blue or red cycles highlighted in relation to the current market. Oh well. Isn't it Ecclesiastes that says "there's nothing new under the sun" or something to that effect? Seems like anytime you think you've stumbled onto something new, someone else already thought of it.
Still haven't seen the red cycle anywhere, though! So maybe no one else has noticed that one, dammit! :D
Here's an interesting fact for ya -- I noticed you highlighed flat vs. zigzag on the chart, presumably to validate Elliott's "rule of alternation." Back-testing has actually shown that when wave 2 is complex, then wave 4 is *also* complex in the majority of cases. The amazing thing is, after all these years, this is Elliott's only rule that has been shown to be incorrect. And to be fair to Elliott, while he called it a "rule," he never meant it to be a rule as much as a guideline.
ReplyDeleteEnjoy your charts, UKDNY, keep 'em coming. :)
After today's action, I suspect that your wave labeled "2" is actually the nominal top. A failed fifth to the contracting ending diagonal count.
ReplyDeletelol -- really not so bad to have your kids take an interest so early. IMO, many of the problems with our leadership exist because not enough people are paying attention to what's actually happening. Kudos to you for raising kids that will take an interest.
ReplyDeleteI thsought you said your dog does not bite!
ReplyDeletevery nice..thank you
ReplyDeleteNot as far as I know... If it does, I'd love to know how!
ReplyDeleteAR, I have unflagged yer comment.
ReplyDeletety Arnie. :)
ReplyDeleteI have a lot of respect for Mauldin. Definitely one of "the good guys."
ReplyDeleteTy, Jim. I have been working on charting dish buildup in the kitchen sink. Buildup is bullish when my wife is feeling lazy, and bearish when she's more motivated. Sometimes, buildup gets so bullish that I have to intervene, for fear that a bubble is developing...
ReplyDeleteThanks dave.
ReplyDeletelol, sort of.
ReplyDeleteyw jbg.
ReplyDeletety WS.
ReplyDeleteyw, Ray. :)
ReplyDeleteThanks Phoenix.
ReplyDeleteHmm, hits and posts down a bit today. Bears have given up hope, methinks.
ReplyDeleteThe thing I keep wondering is: when I'm bullish at times, will I lose the majority of my readers? When I KO'd the SPX count on February 8 and insisted it would break its 2011 highs, it was pretty unpopular -- and that was just 30 points or so. What happens if I turn really bullish? :o
NDX broke the blue melt-up channel and bounced right at the red channel (see chart).
ReplyDeleteBah humbug!
ReplyDeleteEEz noot my doog..
ReplyDeleteOptionXPress, yes.
ReplyDeleteThe cycle tool lets you mark two points on the chart, and it repeats the timespan across your chart. It doesn't assist you in the discovery process; the 2011 high and low seemed like good candidates for this.
Here is the all-SPX chart with this cycle shown, the vertical blue lines. The future stuff is collapse bearishness of mine.
Sometimes I need time to adjust my thinking but I always appreciate you shooting straight and helping me see both sides. And I definitely need to learn to trade the trend and not my bias. You help with that so I'm not going anywhere.
ReplyDeleteI would make the distinction between expection of a bearish destiny for the price and expection of easy money from said destiny. Probably most of your readers are convinced of the former but are disillusioned for the latter.
ReplyDeleteB-12 ?? HIT . ouch. that last little sinker today caught me offguard today. i went into the kitchen for a few minutes and it did the happy dive swan dance lower.. living dangerously until we get above 20 :)
ReplyDeletelol -- I've only used OX for over a decade. I had no idea it did this. ty -- now I just have to figure out how.
ReplyDeleteBy the way, PL, I opened a SpeedTrader account today via your blog link. The real account, not the free demo. They gave me my account number but said they're still processing it.
ReplyDeleteInteresting thought PL.
ReplyDelete$SPX/480
ReplyDeletehttp://www.screencast.com/users/katzo7/folders/Jing/media/42dfca4d-6933-4259-ab29-c869c78f4718
I appreciate both sides of your analysis. I try not to post much but just observe. I did like the move to 2650 on the NDX. Thanks for the confirmation on that one. Sometimes I don't trust my observations. It nice to find a place for both sides of the coin. Thanks again.
ReplyDeleteTy, DD. I had to open a case w/ them, because they never paid me for katzo's. Haven't heard back from them yet, but I suspect I'll probably need to do the same thing w/ yours...
ReplyDelete"turn really bullish"....We'll send this guy after ya...
ReplyDeletehttp://www.youtube.com/watch?v=hB6Z4VwIRgU
Isn't bear capitulation the unscientific cardinal sign of a downturn?
And I did open an OX account through the link you sent me...is there anything else (besides fund it) that I need to do?
ReplyDeleteme like
ReplyDeletety... not that I know of, but I think it takes awhile before they actually deposit the money in our accounts.
ReplyDeleteJust for S's & Giggles I bought a fake gasoline contract last week...Holy Hannah, I checked it next day and it had popped like $4800 on the single contract. Soybeans seemed pretty civilized too. Question on setting up a proper shop...How many screens do you run without getting overloaded?
ReplyDeleteThe risk/reward is well in the latter's favor....living dangerously isn't so bad anyway :)
ReplyDeleteLet the party begins. Look at that drop in AUD/USD, good proxy for spx....will see what happens in the morning
ReplyDeleteI usually run Xtend on one, streaming charts on another (usually at a 1-minute and/or 3 minute time frames), plus Stockcharts. I monitor (infrequently) back and forth between the streaming charts at the short time frame, and use my Stockcharts stuff for an overview of the bigger picture.
ReplyDeleteXtend then gives a nice overview of the total market ticker, and my watchlists, etc. -- which can help warn of a turn coming in other markets.
Personally, I'm not a terribly good multi-tasker, because I get very intensely focussed on one thing at a time. Sometimes my wife will talk to me while I'm trading and I literally *don't even hear her*. Anyway, point being I usually do best when I focus primarily on the ST charts, while keeping a broad overview in the back of my mind, and only checking when the market gets close to the broad levels -- sort of the way I showed the two RUT charts today.
Anyway, I imagine what works best is highly personal, since everyone processes things a little bit differently.
This was a terrific set of charts. I really enjoyed the timing cycle chart. Thanks for the insights as to direction. Although today I did drink the koolaid, ate the cookie and bought the Russell on the dip. Closed the SPY hedge and bought the dip. The thinking being that the market will attempt to frontrun the ADP numbers on Wed. I expect another dip in the am followed by another day like today where the thing rallies back to a strong close. That will be the cue for me to exit and put on some shorts. I think IWM on a rejection near or just inside the rectangle that it just broke down out of and SPY at a failure to reach above 1373.
ReplyDeleteI like the TL, but I assume the wave labeling is automatic? I definitely wouldn't count the late Nov./early Dec. rally as 1-2, i-ii -- that seems like the work of a machine. :)
ReplyDeletety DRG
ReplyDeletePL, what do you think? Not trading advice request
ReplyDeleteur stuck w me PL for now. lol. I'm sure everyone is sick of the vix w me around. :+) sorry.. you have a very cool crew here and all are very informative and helpful. if and when i find the room of jewels and rubies (like in the movie 'Goonies' ) i will throw a luau in your honor..
ReplyDeleteWell, on both of the wave 2 expanded flats, the b wave is too long. B really shouldn't exceed the length of a by more than 138.2% as a general rule. Moving the (i) label then causes everything to be re-thought, since i and iv would cross paths.
ReplyDeleteI would highly recommend working with the cash market first for learning EWT. ES is too leveraged and violates the rules a lot -- personally, I only apply it to ES in a very broad sense.
Hey, Pretzel, sorry, I didn't appreciate the significance of your red boxes, but I took another look.
ReplyDeleteQuestion -- where does the right edge of that last red box land on your chart? Is it ... April 23?
I started calling 4/23 a potential crash date on TickerForum in early January. It has some interesting characteristics:
1. Bradley turn date
2. McHugh phi mate turn
3. New Moon
4. post April ope
5. Big FOMC week
6. 2010 flash crash / sell-in-May seasonality
7. It's timed to be a W3 for an initial W1 if it were to begin this week
8. My own 7-year wedding anniversary, at the Red Hook Brewery here in WA
What say you?
cg
Thanks. The problem with the cash market is that I have no time for it. I do realize what you mean by ES and EWT.
ReplyDeleteyeah i noticed that too, does that mean the uptrend (for the ndx that is) is still not broken, or been stalled/slowed down. So AAPL goes so goes NDX (with 17% being AAPL it ain't that difficult). I also noticed that the NDX put in a higher high on friday compared to wednesday, whereas PSX, COMP, DJI didn't. Does that violate the "wave-5 top is in notion", are can trhe different markets be somewhat out of sink. I personally believe the latter, but just asking to make sure.
ReplyDeleteYou're a stud Pretzel... thank you. I knew you would unflag it if you were aware that it had happened. The same comment was also flagged on another site that uses Disqus. I'd say that's about all the evidence I need to see to know with certainty that past actions by trolls has consequences with disqus that are so severe, that without the help of a blog owner, a guy like myself might as well just stop going to sites using Disqus. It's that Disqusting.
ReplyDeleteBut thanks again partner... that was one post I wanted people to at least get a chance to read.
No Sandy1, it almost assuredly wasn't you. I saw that you liked it and I was so happy I peed my pants, lol.
ReplyDeleteLOL, and u r stuck with me too!
ReplyDeleteTotal bear capitulation! what a great time to sell, and once we're all bearish what a great time to buy, screwing everybody left and right. Gotta love the markets!!! This 2+ month rally with never more than a max 0.5% down day (though bears take note, the NDX was down 1.01% today) and often with similar gains, except for the few overnight future gains days, has worn us all out. So me think everybody thinks this is another one of those days, and tomorrow will be all back to where it started and upwards we go, but me no think so. Why??? Most markets surely bounced nicely off their 20d-SMA averages, which often holds as (intermediate) support, but me think contraction to ~50d-SMA this time. Another way to look at things is in this case plotting 2 sets of Bollinger Bands. One with a stdev of 1 and one with a stedv of 2. The whole up trend , especially since Jan 1st has been almost exactly confined within the 1-2 stdev band (that is both open and closes fall exactly in between 1 and 2 stdev!!). Except for wave iv, that moved down to 1300 (again that was the 20d-SMA back then...), which brought the market within the 1-stdev band, but then it moved quickly back into the 1-2 stdev band. Until today. Today the SPX closed below the 1-stdev band (in between mid-BB, which is the 20d-SMA, and the 1 stdev band to be exact). This IMHO signals a trend change.Combine that with the fact that the SPX traded pretty much most of the day outside of the 2-moth out trend channel and there's only one logical conclusion: trend change has occurred. How long will this last ? Dunno; but (my) rule of thumb is to not hold on to shorts longer than 7 days. Since this was the 2nd down day... you do the math ;-) That would also bring the 50d-SMA as a good target for a bounce off, which often happens when the 20d-SMA support is broken.Namely, for the SPX the 50d-SMA is current at 1319, and increasing with ~7 points per day. 5 more days and the 50d-SMA will thus be at ~ 1350. Sounds reasonable? If the market is "sicker" than we think of course the 200d-SMA becomes the next big target, not to forget all other intermediate support levels.
Not trading advice, just my 1-cent for what it's worth.
I like your math. Thanks!
ReplyDeletehey PL, yes that is correct. The problem I am having is that I think I can count (problem 1!? lol), but problem 2 is that I have a hard time placing those smaller counts in to the bigger picture, e.g. was this wave (ii) of iii of 4 for example? I can count the (ii)'s and iii's etc, but what are they within the bigger picture. That's where your work is so invaluable. I understand it all after the fact, but can't deduct it while the waves are unfolding. Any tips to get better at that?
ReplyDeleteThank you very much for that info. I have also developed the selective hearing skill. I think it is good for a relationship. lol
ReplyDeleteYou are awesome with the VIX. Don't ever think that it's not appreciated. I'm actually missing Jamie Tyrell at this point...that's sad :)
ReplyDeletePL, this is my problem also, which sadly, renders your counts in your article useless to me. So now, I just skim your articles, no longer reading it in any detail.
ReplyDeleteRelated to this, your support and resistance levels are so far away from the minute day-trade movements that they are also useless to me - at least in this particular milieu, where movements are tightly controlled by the presumed bots - so I ignore those also. I'm just relying on my own charting tools, eSignal and Flux, for price pivots.
Sad to say, your big picture analysis is not especially useful day-to-day at this particular juncture. Could you "chunk down" to fit the milieu? Of course, if and when one of those October lows come around again, you'll be a godsend then.
Fascinating. I had to check to find the exact date, because I charted it visually, simply duplicating the rectangles as mirror images after discovering the pattern. To find the exact date, I had to zoom in on the chart.
ReplyDeleteAnd the exact date is (drumroll please) -- April 23. (see zoomed in chart below)
The only thing that doesn't quite work w/ the crash window theory you outlined above is that the cycle appears to be one of lows to lows. So accordingly, the 23rd (or thereabout) should be a low turn date -- at least based on the pattern in the red rectangles. Interesting stuff -- thanks for sharing your thoughts. :)
Well, it's ongoing fits and starts, brother. Sometimes, like most of the prior month, I can come up with accurate ST target zones. Right now, the minute waves are a terrible mess, and trying to come up with any kind of accurate daily targets is pretty much impossible.
ReplyDeleteIt'll clarify again; it always does. As I said in one of the recent articles (you no doubt skimmed through this part, lol): This is pretty normal -- the counts go through phases where they're pretty clear, and they go through other phases where they're open to interpretation. This is one of the "open to interpretation" phases.
I do what I can, and some days have more clarity than others. Until this diagonal (or 4th wave) resolves, it will be hard to predict the next ST move. I'm sure it won't be long.
It's really just a matter of getting good with the theory -- and having a solid grasp of the next largest degree. When you get good at the overall theory, you'll get better at figuring it out in real-time. It's really just lots of work, like everything -- no real tips I can think of beyond having a really solid grasp of the concepts involved.
ReplyDeleteyes, the count is auto but not much else fits. could be a 4 because of the slow steady rise.
ReplyDeleteEverything progressing well, here is a blow up of my 120 chart posted below. We are at 56.75 es [T1 was 57.5] now after the TL and channel top held, more selling as I suggested. Levels brought forward:
ReplyDeleteST tgts
T1 57.5
T2 54
T3 51
Tgts out (longer term, not today but maybe this week)1345 to 48
[you can see I am bearish on the break of 60]
http://www.screencast.com/users/katzo7/folders/Jing/media/5f50fa37-15fb-4cc4-9107-f8c99af7217d
I should have shown the oscillator, it is progressing nicely, a nice new osc. bar forming a lower low on the 120, just what I want to see at this point. Could be wrong but don't try to catch a falling knife by going long all the way down. We should see some real action today after yesterday's respite. $VIX should awake and the eur/$$ is finally showing a better chart today after yesterday's PITA sideways to up move. But my eur/$$ channel held, that is all that counts. Get the direction right and you have the nut. TVIX might move too but I am not impressed with that one. As I said, no rhyme or reason when that moves, moves seems too disconnected for me to get involved at this pont.
Good morning PL,
ReplyDeleteenjoying the discussions about EWT. I'm researching the diagonal at the moment.
Seems a lot of people are unhappy with the Rules and are calling for a revision.... very interesting.
My own view is that leading diagonals and ending diagonals are not the same thing, one is all 3s, the other may have three 5s, they aren't the same and should have different names. And expanding diagonals seem to be found only in the land of unicorns and mermaids.
Meanwhile, I didn't notice at first but the current down stroke overlaps wave 1 so this structure seems complete and we are on the way down.
Further, if INDU is complete then SPX must be and someone needs to sort out the diagonal definition because it sure looks like a textbook ending diagonal on my SPX chart!
Overnight synthetics are well down and dropping : INDU 12,877 / SPX 1,354 / Nas100 2597
Looking good for the bears so lets go down to the woods today!
Kind regards
Good morning SSUSA,
ReplyDeletegreat post... complex and a bit too much for me to digest it all at the moment, so I'm concentrating on EWT but keeping an eye open for others views like GANN theory etc
Keep posting yeah?
Kind regards,
Bulls of a nervous disposition should look away NOW.
ReplyDeletePS the last bear was seen heading for Yellowstone yesterday ;)