Nobody likes an unclear market, least of all me (it means I have to draw extra charts!), but that's exactly what this is -- at least for the short term.
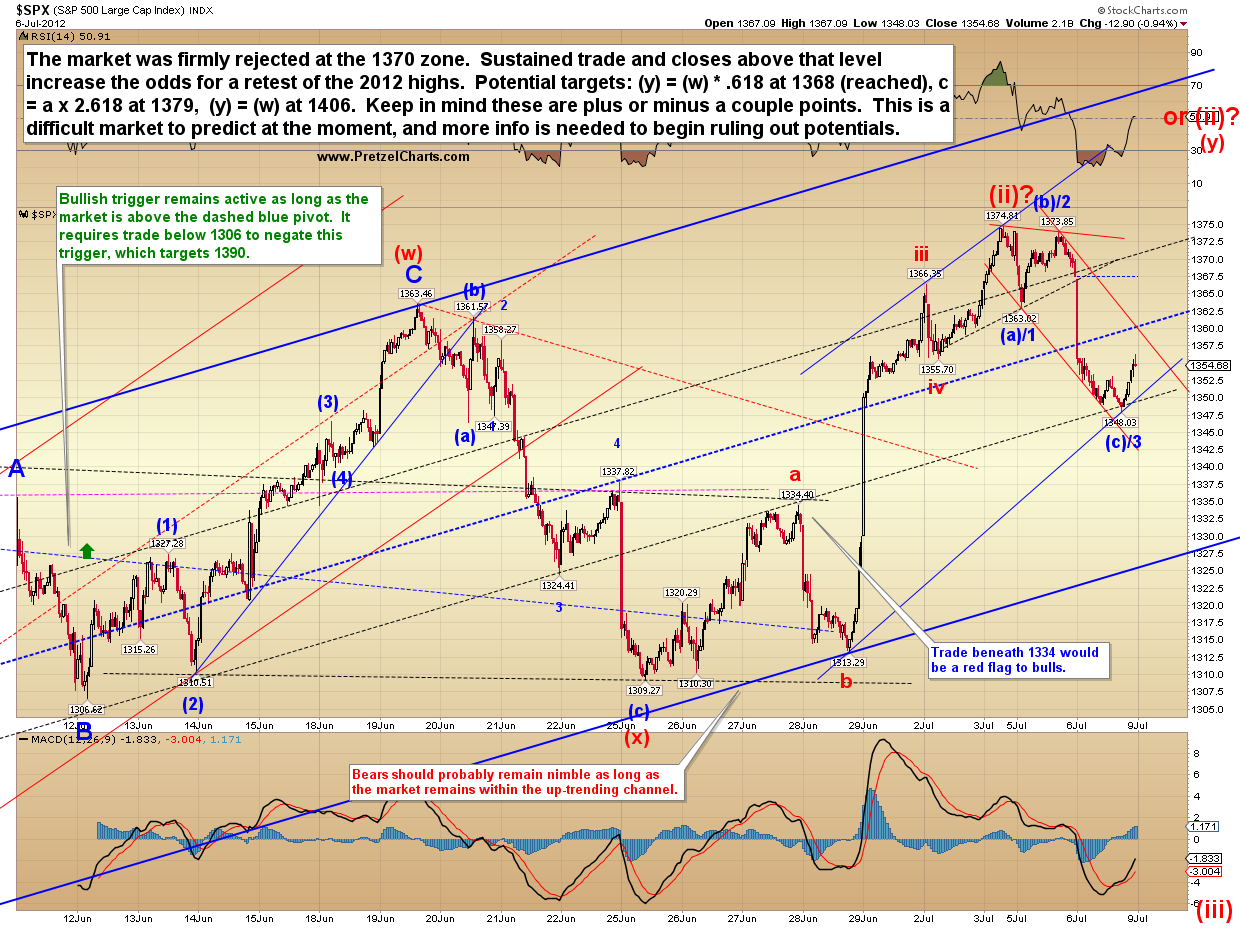
Based on the current big picture charts, I continue to favor the view that an intermediate trend change occurred near 1422 and that the trend is now down. The S&P 500 (SPX) was able to briefly trade and close above the key 1370 level, however that came on a light holiday session and was reversed immediately.
Last week, we discussed a number of signs that the market may be topping, including the McClellan Oscillator (NYMO -- which reached an extreme overbought level), and the up volume/down volume ratio on the NYSE, which suggested very minimal buying interest at the recent swing low. We have also discussed some signals which suggest that the market could still form a higher high -- such as the Advance/Decline momentum, and the Relative Strength Index (RSI) momentum. These messages are not really at odds with each other, because the NYMO tends to be more of an intermediate sell signal, whereas the hourly RSI tends to be more of a short-term signal. But it does make boxing the short-term outlook a bit difficult.
On Thursday, I noted the possibility that the top was in, and that remains entirely possible, especially after the solid down market on Friday -- but from a short-term perspective, I believe the odds still slightly favor a new high coming (call it 60% in favor).
With the short term outlook a bit sketchy, sometimes it helps to step back and view things from the 10,000 foot level... so the first chart I'd like to share is the NYSE Composite (NYA), which presents a different picture than the SPX and INDU. With the NYA still unable to reclaim key resistance, it is difficult to be long-term bullish on this market. An interesting difference between the NYA and SPX is the much-broader NYA shows declining peaks beneath the 2011 highs, suggesting that NYA's intermediate down-trend actually began in 2011. A solid breakout above the upper red trendline would be the first step toward changing the outlook here.

As discussed, the market has kept its short-term options open. I'd like to start with the Dow Industrials, since I feel the pattern is slightly more clear there. I would expect SPX to follow a similar path.
There is a certain amount of tolerance built into the system, and blue wave b is not required to be complete at 12703. It would be acceptable for the market to head a bit lower before heading higher. The broader take-away here is that the charts still suggest a new high could be made on this leg, but I currently would not expect it to break the prior cycle high of 13338.
The main thing bothering me about the idea of a new high for the indices is the fact that major turns usually come when everyone is looking for another new high. So it would not surprise me in the slightest if the top was in already, as discussed Thursday.

While the short-term picture on SPX remains cloudy (first chart below), the intermediate term projections have changed very little since late May (second chart below). Again, over the short-term, a lower low and reversal would be well within acceptable tolerances for the broader count, but any trade beneath 1306 should rule out the prospect of new highs.
Short term:
Intermediate Term:

Solely for the sake of reader visualization, I have also drawn up a simple chart of one of the short-term options that is still on the table. This isn't a prediction so much -- it's more of a warning and for trader awareness. The possibility of an ending diagonal here is reasonable. It could unfold similar to what is shown, but at this point, it's impossible to put a bead on it (if it even happens to begin with) because the market hasn't yet established the converging trendline boundaries. So, take it for what it's worth -- I'm simply showing it now because I can't be there with you during every minute of the trading day. :)

Finally, a quick update on gold, which a number of readers have asked for recently. The wave count here is unclear, so instead of focusing on the waves, I've focused on more basic technical analysis and presented some intermediate bullish and bearish trade triggers.

In conclusion, the market is still in the "chop zone" I warned about on Friday, and its next short-term move is a bit unpredictable. Based on the current charts, I continue to feel that the intermediate-term will bring a significant sell off once the (assumed) wave (ii) peak is in place. This should begin sometime during the next week or so (again: assuming it hasn't already). The outside shot for a more bullish intermediate term resolution cannot be fully discounted yet, but continues to appear much less likely based on the market's recent signals. Trade safe.
Reprinted by permission, copyright 2012 Minyanville Media, Inc.
No comments:
Post a Comment