Commentary and chart analysis featuring Elliott Wave Theory, classic TA, and frequent doses of sarcasm from the author who first coined the term "QE Infinity." Published on Yahoo Finance, NASDAQ.com, Investing.com, etc.
Join the ongoing discussion with our friendly, knowledgeable, and collegial forum community here!
Amazon
Monday, October 19, 2015
SPX and INDU: Giving the Bulls Some Airtime
SPX is finally getting a little bit tricky to read. For the near-term, we've been on the right side of this move (heading both directions) ever since the Fed Spike to 2020 (the first time). Since then, at each inflection point, the market has tipped its hand just a little, allowing the preferred count to capture virtually every dollar of the rally from 1871. Intermediate-term, we've been on the right side of the trade since the all-time-high.
But right now, the near-term has become a bit veiled, and the intermediate picture along with it.
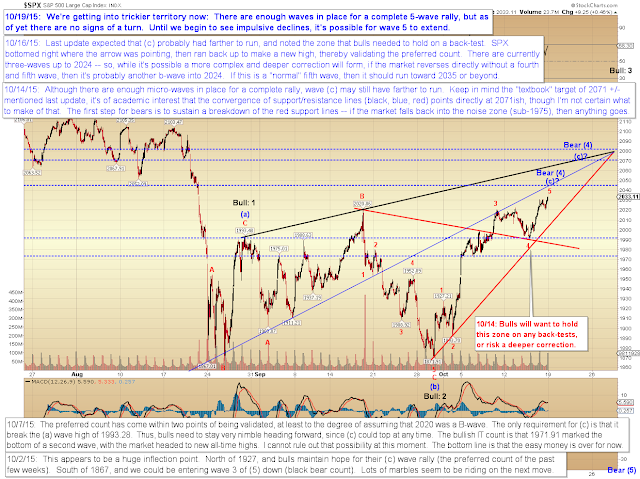
We could be completing a large c-wave rally -- but there are no signs of a turn yet, so it's quite possible the move has farther to run. My current instinct is that we may see a correction unfold here, but the final highs probably aren't in just yet. Don't hold me to that, though: sometimes the market just doesn't want us to know for sure what's coming next. My system got us about 150 points off the low -- right now, that's all I've got. If your system is giving you some type of actionable signal here, then by all means, follow that. I'll let readers know when the wave patterns allow me to form another strong(er) opinion.
TRAN is interesting now, inasmuch as it stalled shy of the next key upside level, then started to back away from that level. This keeps all options open for the time being.
I can't do much to influence the market, but for the sake of bears, I'll try to do my part here. Speaking generally, I can sometimes completely end a move by finally giving more airtime to a wave count that considers the preferred count may have been too conservative or too aggressive. (I'm being facetious, of course -- I can't end a move all by myself! It takes thousands of readers collectively considering whatever chart I put up, in order to end the move. It's more of a group effort!)
So, here's a chart that could end this rally: A more bullish flat than previously supposed.
Here's another interesting chart: The red line represents the approximate boundary of the Massive Multi-year Megaphone (or "MMM" for short -- no relation to the sound people make about ice cream, or to Massive Multiplayer Online gaming.). If you don't know what Megaphone I'm referring to, just Google "Fully leveraged short position total account wipeout jaws of death the top is in. Again." and you'll probably pull up 70-80,000 references -- mostly from folks who were a little early.
In conclusion, we're into an inflection zone that could generate a turn if this is a basic (c)-wave with a very simple and straightforward structure (approximate percentage of the time a structure is completely straightforward: 0.0002%). We're still a little short (no pun intended) of the "textbook" target for this wave, though, so it's quite possible there's more room for the rally to run, and my instinct is that it probably will run at least a bit farther, possibly after a correction. Nevertheless, we're very near a point of perfect balance, so I'll keep watch for impulsive waves in the downward direction, which will be our first solid indication of a turn -- and I'll also keep watch for near-term patterns that signal how much more upside could be left (if any, of course). Until then, trade safe.
Subscribe to:
Post Comments (Atom)


No comments:
Post a Comment