Amazon

Friday, January 18, 2013

SPX Finally Captures Long-Standing Target of 1480-1490


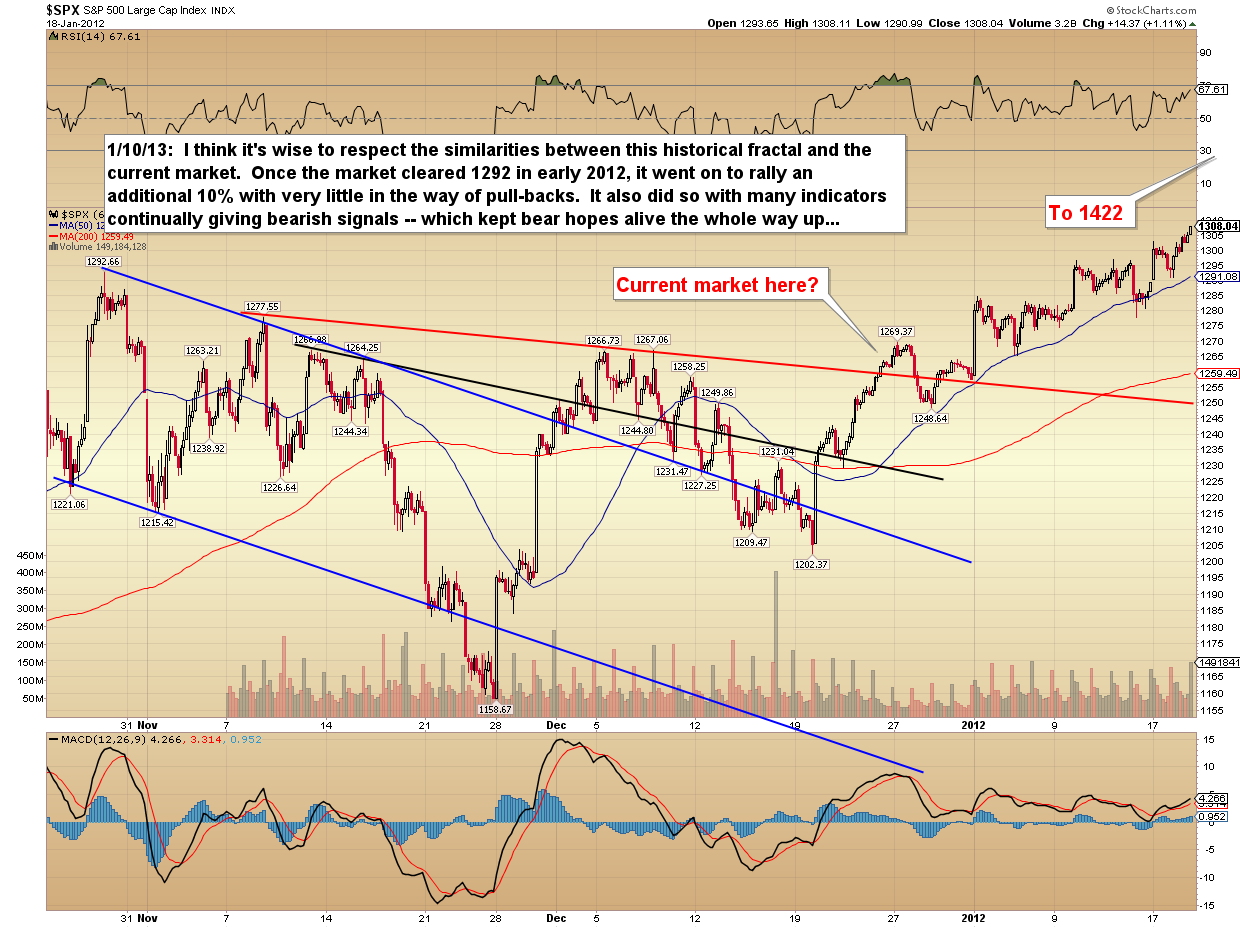
Wednesday's update noted that SPX 1467.56 should serve as a dividing line between a deeper correction and a trip directly into my long-standing target zone of 1480-1490.  Amazingly, the market found a bottom at 1467.60 , then proceeded to rally up to 1485 (somebody out there nailed a perfect risk/reward trade entry!).

Note the 32 point trade trigger of December 20 was also finally captured in the process (1448 to 1480).  Going back to November's updates, there was one big scare along the way (when 1411 broke) which switched my public stance to neutral, but all the blue target boxes since November have now been reached.  Even before the fiscal cliff scare, my "safe" target of 1445-1455 had already been captured; so all told we've captured a bit over 100 points of the rally since November 19, 2012.

Which brings me to a thought I'd like to share with readers:  My biggest complaint with myself from the recent past is that I didn't stick to my bullish guns in the updates during the fiscal cliff scare... and I'll tell ya' exactly why I didn't, too: simply because I'm not so arrogant as to think I'm never wrong. With the market in that position, with a big third wave decline as a very real potential, I worried about "convincing" anyone to go long and possibly having my readers get caught on the wrong side (if I was wrong). So I switched myself to neutral publicly, because that was a dangerous position for the market, and especially dangerous for cash traders. Privately, I remained bullish.  In retrospect, obviously, I wish I had stayed more publicly bullish.

It's a tough gig. Losing your own money is one thing, and I view that as part of the game... but feeling like you "lost" someone else money is almost unbearable at times. I've lost sleep on many nights over this -- and not just when I'm wrong. Sometimes just when I'm bold and worried about being wrong and misdirecting someone. 

Respect to the brokers in our audience -- you know who you are!

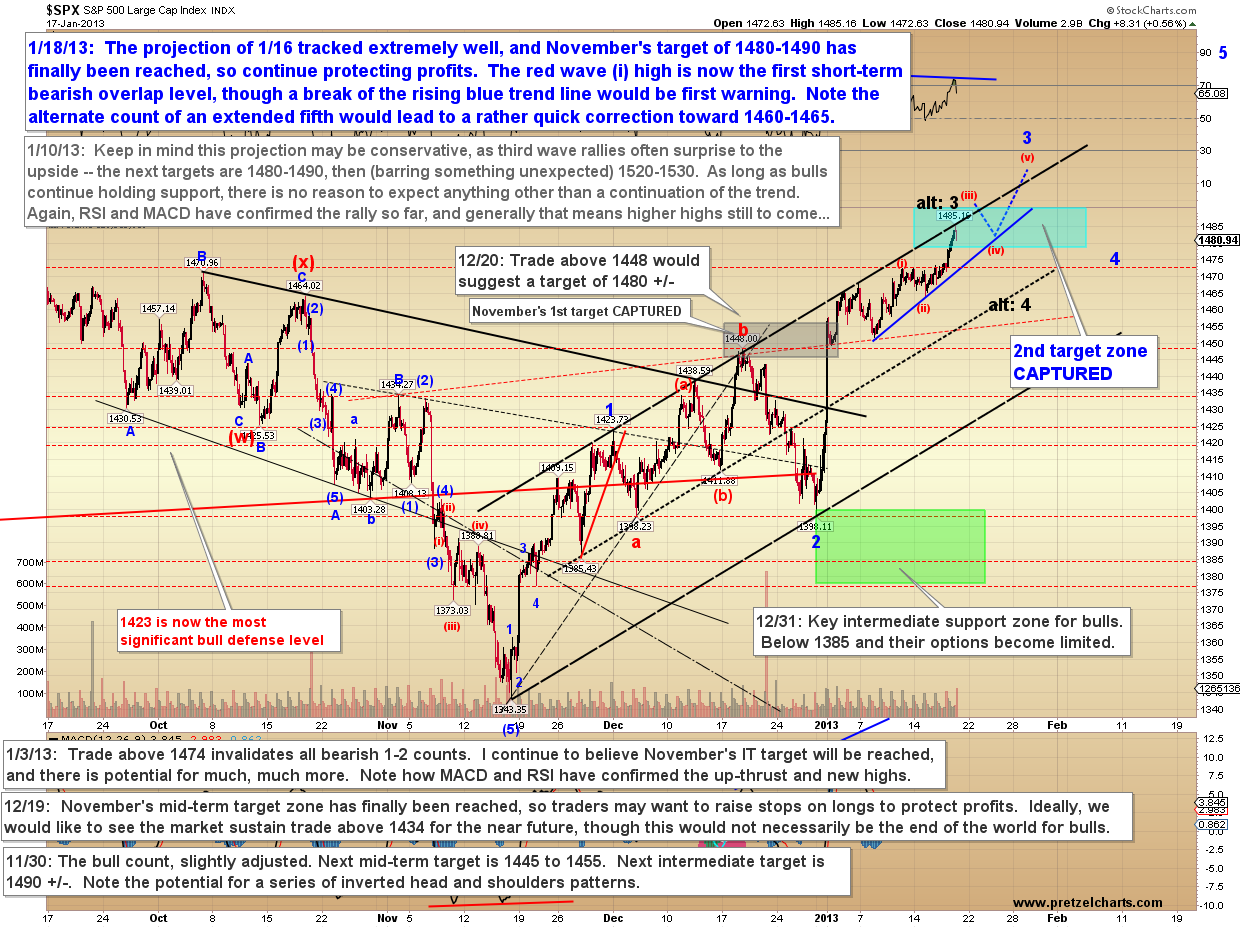
In any case, the question now, of course, is: what next?  Well, I don't get 'em all right, so I can't promise anything, but it does appear that SPX still needs a higher-degree fourth wave correction and fifth wave up, at the minimum.

As always, once a target zone is reached, reversals become a bit higher probability.  There are some indications that the rally could be nearing a turn, but as I've been noting all month, this is a third wave rally, and third waves love to blow up everyone's favorite indicators (this is actually why I haven't been publishing much lately about divergent sell signals and such -- those types of technical indicators rarely work during third waves). 

The traditional count is outlined in red, but the alternate count is not at all unreasonable and would be suggested with trade beneath the red wave (i) high.


The Philadelphia Bank Index (BKX) is also hinting at more upside after the next correction.  Note the pattern here, and an upside breakout over the dashed blue line should lead to 54.80-55.


In conclusion, as I've mentioned since the beginning of the year, I have no intention of trying to call a top in this wave until I see the first impulsive decline.  That said, a long-standing target zone has been reached, so it's time for traders to decide whether to take profits or chase the move higher with stops.  Trade safe.

Reprinted by permission; Copyright 2012 Minyanville Media, Inc.

Wednesday, January 16, 2013

Euro Update: Yesterday's Call Blown, Targets Postponed or Negated


I was going to take today off, but I felt obligated to update Euro.  In yesterday's update, I discussed the fact that Euro appeared ready for a deeper correction; however the wave I was anticipating fell well short of my expectations, and Euro found strong support right where it needed to.  It's now formed an incredibly symmetrical reversal pattern, and is almost certainly headed to retest or (more likely) best the previous high.

In real-time, this pattern became apparent as it unfolded, but that doesn't do readers any good, and I apologize for blowing this one.

Note the bear hope that still remains is depicted by the alternate count.  If this is the alternate count unfolding, that count is quite bearish, but I'm not going to pretend it's what I was expecting yesterday.  The alternate count is, in fact, considerably more bearish than the count I had posted.   

The white ABC forms a complete fractal, and that suggests the alternate count is lower probability -- but because these are fractals, a complete fractal sometimes only marks the first wave of an even larger fractal.  A triangle would also not be entirely out of the question here, so be on alert for that pattern if the rally falls short of the previous highs and embarks on a deep correction.

It pays to be aware that if the Wave C low is broken in the near future, an extremely sharp decline is almost certain to ensue, and yesterday's targets will become active once again -- so if one is bullishly inclined, the stop-and-reverse (SAR) level is clear.  On the other side of that coin, a break of the wave B high should lock-in the corrective nature of the decline. 


My apologies again for reading this one wrong yesterday and I'll return with the equities updates tomorrow.  Trade safe.

SPX and Euro: Euro Ready for a Correction


In yesterday's update, the preferred short-term count expected the S&P 500 to decline to 1461 +/-, then reverse to new highs.  The market found a bottom two points shy, at 1463, then moved up to make a very marginal new high.  Normally, we'd now expect a standard five-wave impulsive rally to unfold over the near-term, but I've outlined a second potential path because the option's still open, and I have a suspicion about what the market may be planning here for the short-term.  Targets for the two most-likely near-term paths, and levels to watch to differentiate the two, are listed on the chart below.


Note that both short-term counts presently expect this move to resolve higher, this is simply an option to be aware of, because expanded flats (the green path outlined above) often get traders on the wrong footing, since they almost always kick out the last swing low before reversing higher -- in other words, they behave just like the move I predicted yesterday.  This is basically a larger fractal of the same type of structure.

The hourly SPX chart is shown below, and there's nothing in the charts yet to suggest that November/December's upside target zone won't be reached -- though the market has now come within 7 points, and sometimes "within a few points" is as good as it gets in this business, especially for long-standing targets.


The main thing bothering me right now for equities has nothing to do with the equities charts:  I've been trading the euro/US dollar currency pair all night, and I suspect euro is on the verge of a steep decline toward 1.312-1.314 in the next few sessions.  Although there's no guarantee this will impact equities, it's a factor to remain alert to.

Below is a chart of the FXE currency shares euro trust.  While the numbers here vary slightly from the actual Forex market, the wave count is the same.  The retrace target is listed using the actual Forex rates -- if the most recent rally was all of wave (5), then an even deeper correction will ensue.

NOTE:  Intraday real-time adjustment on Euro -- I reworked my micro count in Euro/USD and it is entirely possible that an ABC completed at last night's low.  It all comes down to key support now: as long as 1.32559 holds as support, it may move to new highs from here... and bears probably don't want to see it back above 1.33471 at this point, or it could easily go back into launch mode.  Below 1.32559 and the target becomes active.

(continued, next page)

Tuesday, January 15, 2013

Time for Caution, Though No Reason to Be Bearish Yet


The updates have been suggesting higher prices all month, and the waves are still pointed upwards for the moment -- but I do want to show a few charts that act as caveats and suggest some degree of caution is in order.  The equities markets have remained a bit fractured, in the sense that related markets often seem to be suggesting completely different things -- and this is still making it difficult to predict exactly where we are in the larger picture.  I continue to lean bullish, but a little caution is now in order.

To illustrate the fractured nature of things: the S&P 500 (SPX) is suggesting a smallish correction that holds above 1451, then on to new highs.  But the NYSE Composite and Philadelphia Bank Index (BKX) are hinting that a larger correction may ensue.  There's simply no way to know for sure which it will be at this phase: we're too close to the recent highs to project much to the downside. 

Let's start with the short-term SPX chart.  This chart shows what is almost-certainly a three-wave rally into the 1472 print high, which suggests an expanded flat is unfolding (or already complete).  The expanded flat seems to connect the rally from 1451 to the wave that is unfolding now, which suggests the first part of the rally is simply wave (1) of (5) of the larger wave 3.

Note that the corrective fractal could be complete at the red wave A/alt: (4) label, in which case higher prices are due directly; this appears less likely, but trade beneath 1465.69 is required to confirm the 1461 target.  The only way to eliminate the bullish (1)/(2) potential of this chart is for the market to break below 1451.  Compounding the issue is the fact that the waveform from 1451 is exceptionally weird.


Moving out to the 30-minute SPX chart, we see how this wave fits into the bigger picture (labeled as red (i) (ii) and (iii) on this chart).  Note the alternate count that ALL OF wave 3 has completed.


There are no meaningful signs of a turn yet, but both NYA and the Philadelphia Bank Index (BKX) are sporting the potential of complete rallies.  The challenge here, though, is that the same structure discussed in SPX is entirely possible, and the wave labeled as "v?" may only be wave (1) of v.  There's simply no way to tell this early, but I would be remiss not to warn. (continued, next page)

Monday, January 14, 2013

A Survival Guide for Bears in a Bull's World


Ah, it's open season here my friend.
It always is; it always has been.
Welcome, welcome to the U.S.A.
We're partying fools in the autumn of our heyday.


And though we're running out of everything,
we can't afford to quit.
Before this binge is over,
we've got to squeeze off one more hit:
We're workin' it.

.....

We got the short-term gain, the long-term mess,
we got the suffocating, quarterly consciousness.
(Yes man, run like a thief.)

New York to Hollywood, hype and glory,
special effects, but no story.
(Yes man, run like a thief.)


- Don Henley, Working It

There's been no material change in the market outlook, so today I'm going to focus on discussing the world's fundamental debt problems, and how those problems may impact investor psychology.

Let's imagine you found yourself in an H.G. Wells novel, and used his famous machine to time-travel into the future to a random, unknown year.  As fate would have it, you just happen to land in the exact year when there's a worldwide financial meltdown -- but before you can find out what year it actually is, your time-machine whisks you back to the present, and then ceases functioning.

You are now in possession of powerful, and somewhat frightening, information.  You know this financial meltdown will happen at some point in the future, but the problem is: you don't know when.  It could be in two weeks, it could be in two decades.

You are an investor and a trader, so suddenly you look at the market and wonder:  "What if this future I experienced happens tomorrow?"  You react emotionally, rightfully worried, and you immediately pull all of your investments out of the market.  Then the market starts going up, and you wonder again:  "Hmm.  What if this future happens many, many years from now and I miss out on everything in-between?"  You have powerful knowledge of the future -- but how can you profit from knowing something will happen, if you have no actual time frame for knowing when it will happen?

I use this analogy because I think many bears have fallen into a very similar trap for years.  Bears tend to be smart, free-thinking individuals, who are a bit contrarian in nature.  This feeling of being contrarian isn't really by choice; it comes from the fact that bullishness is packaged as the "American Way," and the mainstream media often mocks bears openly with a variety of semi-demeaning nicknames.  These names run a wide gamut, from Nouriel Roubini's media-dubbed nickname of "Doctor Doom" all the way to Peter Schiff's media-dubbed nickname of -- you guessed it -- "Doctor Doom" (nobody ever accused the media of being creative).  The mainstream media's propensity to nickname anyone who's bearish as "Doctor Doom" (also: "Professor Doom," "Mister Doom," "Cousin Doom," "Big Daddy Doom," etc.), understandably makes bears feel they are ostracized and outcasts.

The funny thing is: many bears started off as bulls, and then felt they had some type of catharsis -- some type of "informational awakening" -- which converted them into bears.

I had this fundamental conversion experience in the late 90's, and yet I have been very bullish on the market at several points since.  I'll explain why in a moment.  In my heart, I'm bearish on the fundamentals, because I believe the massive debt that the world has accumulated is completely unsustainable.  We have reached levels of public and private debt that are wholly unprecedented, to the point where the term "record levels" is an understatement.

According to the Bank for International Settlements, the debt of governments, private households, and non-financial companies rose from 160% of GDP in 1980, to 321% of GDP in 2010.  After the figures are adjusted for inflation, the world's governments have more than four times the debt levels of 1980, and private households have more than six times the debt.

(continued, next page)

Friday, January 11, 2013

The Pattern Repeats: Is It Really This Simple?


Last update noted that new highs were expected directly, and the market has obliged and now kicked out some key intermediate levels to the upside, suggesting the rally will continue.  There's really not much to add to the bullish expectations and projections of the last couple weeks-worth of updates, and the market continues to perform in line with my preferred bullish wave counts.  I'm anxious to see if my intermediate target of 1490 +/- from November will be reached on this leg, as it's something of a long wait between the time an intermediate projection is published and the time the market actually reaches it (or doesn't). 

There's still nothing in the charts that's screaming "sell!"  When looking at a long-term chart of the S&P 500 (SPX), we can see obvious similarities between the current pattern and the last two rallies.  While the market always reserves the right to create confusion or to have a pattern fail, the present pattern is quite bullish, and a trip into the mid-high 1500's would be an entirely reasonable result.


I'm also reprinting the zoomed-in December 2011 fractal, because I do think it's relevant.


The updated 30-minute SPX chart is shown below.  Assuming the recent rally off 1451 doesn't mutate into something more complex or unusual, it appears ready to move higher.
(continued, next page)

Thursday, January 10, 2013

Is the Rally a December 2011 Redux?


In yesterday's update, I noted that I believed the downward correction had ended at 1451, and expected higher prices directly.  The market headed up a few points yesterday, and continues to appear poised to reach new highs.  Due to the position of this wave in the big picture, it is quite possible that my short-term upside targets are too conservative, though a "standard" wave would be nearing a turn and deeper correction.  As I noted on January 2:

...this is not a rally I would look to short anytime soon.  There is massive pent-up energy in the charts, and nested third waves are not to be trifled with.  Third waves are the "point of recognition" for the masses, and tend to be strong trending waves that rarely let up for very long.  Third waves tend to peg indicators at extreme readings and stay there for much longer than seems reasonable.


I do want to briefly call attention to the similarities between the current wave and the intermediate bottom which formed in November/December 2011.  I recall that rally as being one which defied gravity, and which bears kept trying to short (myself included at times) -- and yet it ran on and on for months.  The present rally has similar hallmarks; the difference is the present rally falls in the third wave position at higher degree, and that suggests it should actually be faster and stronger than the previous wave.


In conclusion, there's little changed in the outlook of late.  So far, there are no indications of any kind of significant top.  Trade safe.

Reprinted by Permission; Copyright 2012, Minyanville Media, Inc.

Wednesday, January 9, 2013

SPX, NYA, RUT: Market Consolidates Recent Gains


Yesterday the market spent some time consolidating its recent gains.  So far, there's nothing to indicate this is anything other than a correction before the rally continues, though as discussed in prior updates, we should remain cognizant that several markets are approaching (or have reached) long-term resistance.  I’m trying to weigh that fact against the indications that this is a third wave rally -- and that means I'm unwilling to attempt to front-run a turn, and will wait for the market to lead in that regard.

To further illustrate that point, the first chart I'd like to share is the NYSE Composite (NYA) daily chart.  The long-term resistance zone is about the only thing bears have going for them here.  Since 2011, the NYA has done nothing but muscle through resistance level after resistance level.  As I've noted on many occasions since September 2012, there is just nothing bearish about this chart.  The mirroring shared between the last few months of the current rally and the first few months of the 2011 mini-crash is interesting.


Next, I'd like to update the Russell 2000 (RUT) chart, which I last published on December 19.  I noted then that I felt the pattern was intermediate bullish no matter how you sliced it, and RUT has now reached the lower edge of my previously-published target zone.  It does still appear to have farther to run, and I've outlined one potential path in blue.  I continue to believe RUT will act as a pretty decent litmus test for the rest of the market, and if it can claim the 902 level that's mentioned on the chart, it's going to be a bit more challenging to find much in the way of long-term bearish options for this pattern.


Finally, the update for the S&P 500 (SPX), which presently looks like it completed a small ABC to wrap-up red wave 4.  Back below 1451 would open up the potential of a deeper correction, with the first target being 1440-1445.

Again, there's presently nothing to be bearish about in this chart, and this simply isn't the type of wave where I'm eager to try and front-run a turn -- third waves can run on much longer than one thinks is reasonable.  If the market gives some signs of turning lower, and starts looking impulsive to the downside, then I'll discuss more bearish potentials. (continued, next page)

Tuesday, January 8, 2013

The Importance of the Market's Current Inflection Point


Friday's update noted that the market was approaching an inflection point, but expected that the S&P 500 (SPX) had at least one more fourth wave correction and fifth wave higher still to come, which the market fulfilled.  The short-term charts are in a bit of flux at the moment; so I'll discuss the short-term later, but want to focus on the long-term in this update.  In most recent updates, I've focused on the long-term bull potential, which I'm still favoring.  I should probably make it clear that I'm not suddenly flipping to the bear side here, but nevertheless, I do want to bring a bit more balance to that discussion.

I want to start off with a chart that does a reasonable job of highlighting the long-term importance of the current inflection point.  The Philadelphia Bank Index (BKX) has broken out and back-tested a bullish basing pattern, and is now in a critical long-term resistance inflection zone.

The problem for bears is that this chart simply isn't bearish -- it has bearish potential; but it's important to understand the difference. 


The chart below zooms in a bit on BKX and discusses the likely wave structures and targets.  While BKX has loved blow-off tops of late, I have to favor the more traditional market pattern, which is that the strongest waves usually fall closer to the middle of the pattern -- thus suggesting further upside is still out there after the next correction.


The Nasdaq 100 (NDX) also continues to highlight how critical the current zone is for bears to defend. (continued, next page)

Friday, January 4, 2013

Do Not Feed the Bears


Last update expected higher prices, and the SPX rallied up to break 1464, which puts a big dent in the straightforward bear counts (which, for new readers, I have not favored) -- nevertheless, this weekend, I'm going to cover the bear case in more detail.

First, a quick picture of my new favorite t-shirt.  I've been bullish on the market for the last few months, because that's where the technical picture took me.  But I'm still a bear at heart.


I'll briefly touch upon the bear case today, starting with a chart of the Nasdaq 100 (NDX), which features a much cleaner structure than many other indices, and does suggest that the market is approaching another inflection point.  Inflection points are not necessarily bad news, but they are areas where trend changes have a higher probability than usual.  The NDX chart notes some details, including a typo -- it should read "2598 is critical support"(!).


Next is the S&P 500 (SPX) preferred count, which still sees higher prices -- though, here as well, a correction may be drawing near.  Note there are two different bullish ways to view the rally structure.  My preferred interpretation is shown below, another option is shown on the hourly SPX chart.  Of course, the bearish ABC can't be fully ruled out yet (noted below). 


It's also possible to view the rally as a deeper nest of first and second waves.  The entire correction is quite unorthodox, and thus it's pretty open how you want to view it.  It's something of a moot point at this moment, as both interpretations ultimately point higher. (continued, next page)

Thursday, January 3, 2013

SPX, NDX, BKX, INDU: Charts and Fundamentals; Why the Rally Should Have Legs


Last update noted that probabilities favor that this rally leg since November is only half-way complete. I continue to favor that view. Yesterday performed as expected for a nested third wave rally, and the bear count (which I’ve discounted since October) is very close to being invalidated once and for all. Trade above SPX 1474 would accomplish that.

This market has an awful lot of bullish potential, but what can bears do to put an end to it all? In this update, we'll cover, in brief, some key signals and price points to watch going forward. There is also one important fundamental factor, which suggests more rally fuel, which I’ll cover later.

The first chart I'd like to share is the Philadelphia Bank Index (BKX) which, as long-time readers know, I believe has acted as a critical "tell" over the past months. BKX has finally vindicated my view that the November low was, in fact, an intermediate bottom, and that the decline into that low was corrective. The chart below is the daily BKX and covers the two most likely wave counts.

(If you’re new to Elliott Wave Theory and don’t understand how it works, you may want to review my article on the subject: Understanding Elliott Wave Theory, Part I)

As noted on the chart, the first bearish option isn't particularly bearish, at least over the intermediate term. The first bearish option would see this as a three-wave rally, which could complete after another small leg up or two, then a large correction (50-62%), followed by another new high.

The bullish count is exceedingly bullish, and, without any present evidence to the contrary, I am left to continue favoring that count. Currently, the bullish potential is such that one probably simply wants to chase the market higher with stops, since if this is the "nested" third wave depicted, it will only correct from time-to-time on its way higher (much like yesterday's action).


The S&P 500 (SPX) outlines the preferred bullish option, and notes some key levels. The bears' final hope here is that the wave I'm viewing as wave 3 is actually wave C of an ABC correction (shown in more detail on the INDU chart which follows). Trade above 1464 would put the bear count under severe duress, and trade above 1474 would finally lay it to rest.


In my opinion, the Dow Jones Industrials (INDU) continues to make the bear count low probability. The pattern here is a bit harder to reconcile as an expanded flat and -- while there are always corrections along the way -- that suggests the rally will continue to have legs for the foreseeable future.  I have outlined the first two key levels bears need to reclaim in order to begin creating doubt.

(continued, next page)


Wednesday, January 2, 2013

SPX and US Dollar: Rally Likely Only Half-Way Through


Last update, the market had finally flipped me from bullish to neutral -- but I noted that the market was clearly set-up for a large directional move (in fact, I titled the article "2013 Should Come in with a Bang").  I also noted the market seemed to be waiting on the fiscal cliff resolution.

I've been pretty consistenly bullish since November, but I won't deny that by last update, the bears had shaken my faith quite a bit. They pushed the market right to the edge; however, I felt they had not yet tipped it over and that critical support had not yet been breached.

Well, now we have our resolution, and -- proving that procrastination can be a winning strategy -- Congress has managed to live up to the phrase "Necessity is the mother of invention."

There is a very bullish set-up in the charts, and it's likely that we're only about half-way through this leg of the rally (with potentially much more to come over the long-term).  November's intermediate target of 1490 +/- seems quite likely to be reached in the next few weeks or sooner. 

As I noted in the last update, the Philadelphia Bank Index (BKX) was signaling the potential that the whole decline was complete, and overnight futures are now indicating that potential is indeed the reality. 

The short-term BKX chart, which was posted as a waypoint on Monday, is updated below:


Given where the futures are trading this morning, the bear count is likely to be invalidated directly upon the open -- and a big gap up fits the pattern of a nested third wave rally (the expectations of the pattern) therefore, I'm not inclined to update the bear count at this time.  I feel the bear count will become extremely low probability once the market trades above 1448, and that break will all-but-guarantee new highs above 1474.

At this point, it will take something completely unexpected, or a break of 1398, before I consider the bears as serious players again.


It should be noted that there is extremely bullish potential in the current market.  This appears to be a third wave rally at several wave degrees (note the red ii at the November low), which opens up potential for a preliminary long-term target of 1680ish.  There is another option, called an ending diagonal, which is less bullish, but would still see a trip into the high 1400's at the minimum.  The bottom line is that the preferred intermediate counts of the past several weeks range from "pretty bullish" to "exceedingly bullish."

I do hope my warnings recently kept bears from over-committing.  I know a lot of technicians were quite bearish of late, but I felt the bears never quite clinched the deal for a number of reasons.  And every now and then in trading, just as in life, gut instinct beats everything.  As I noted on 12/27:

Bears have a definite shot at taking control, and there are a number of signals right on the cusp of rolling into their favor -- and yet I have a gut feeling that bulls will somehow manage (yet another) stick save here. 

Last update, I published the triangle potential that I had noticed in the US dollar -- and until 78.60 is broken, that potential remains for the time being.  However, I continue to favor dollar bears for the intermediate term (either directly, or after further consolidation), and below is the preferred wave count for USD.  The first alternate is the extended sideways correction (triangle; not shown), which basically just stretches out the consolidation before ultimately heading lower.  I would rethink that outlook if bulls reclaim 81.46. (continued, next page)

Monday, December 31, 2012

2013 Should Come in with a Bang


Some markets are inherently difficult to predict and trade.  They whip up and down, they make higher highs, then they make lower lows, then they reverse.  They shake everyone out of both sides of the trade -- and then, after they've messed with enough players, they run.  This is one of those markets, and it's gearing up to run.  That pattern is such that it probably shook out many bears right near the top, and has since shaken out many bulls.  Now it's almost time for it to pick a direction.

For the past week, I've noted that the market had reached an inflection point -- and while the market's reaction to an inflection point isn't always predictable in advance, these points do represent a challenge to the market, and thus always open up the potential for a change of trend.  The bears managed to seize control at that inflection point, and have not yet let up their chokehold since. 

Meanwhile, Congress has only had a year to work out the Fiscal Cliff dilemma, so of course here we are in the eleventh hour, still trying to figure out what to do about it.  In alignment with this uncertainty, it's interesting the position the market has placed itself in -- it hasn't locked-in the bearish count, and it hasn't locked-in the bullish count.  It's still floating in inflection point limbo, and it seems to be waiting for the starting gun to fire.  One thing that does seem clear is that it's going to make a large intermediate move very soon -- but the market seems uncertain on the direction yet.  When the market commits, I'll follow suit.

Everyone seems to be looking at how bearish it would be if the Fiscal Cliff deal doesn't get done -- but what happens if it does?

There are still mixed signals in the charts, and the daily chart of the Dow Jones Industrials (INDU) helps illustrate the challenge.


Zooming in on the INDU chart, we can see that the rally since November is only three-waves so far, but it has not yet knocked-out the critical low to lock-in the rally as corrective (corrective moves are always expected to be fully retraced).


I'll admit, many things look very bearish -- but until the market dictates otherwise, I have to continue considering the bullish wave counts as viable possibilities.  12765 on INDU and 1385 on SPX is where the bulls become severely handicapped.  Below is the S&P 500 (SPX) bull interpretation with noted levels: (continued, next page)

Friday, December 28, 2012

Publication note


Unfortunately, I had a minor family emergency occur as I was beginning the update, and it has required my full attention for the last several hours -- so the update will return on the weekend.

Good luck out there, and trade safe.

Thursday, December 27, 2012

SPX, NYA, US Dollar, VIX: Inflection Point at the Edge of the Cliff


Last update noted that the market had reached an important inflection point, and that remains true today.  It's interesting how the market has aligned itself to react to the news over the next few sessions.  Obama cut short his Christmas in Hawai'i (where I reside) to fly back to Washington in order to discuss the "Fiscal Cliff" and how to avert falling off it.  The market seems to be keyed into those talks.

Meanwhile, I keep thinking of a scene from the movie Margin Call, in which Paul Bettany is standing atop the ledge of a skyscraper and says, "The fear most people feel when they stand on the edge like this is not actually a fear that they will fall.  Instead it's the subconscious fear that they might jump." 

One sometimes wonders which it is for our leaders: the desire to avoid falling... or the other.

In keeping with this theme, bears have taken the S&P 500 (SPX) right to the edge of its own cliff, and it's now teetering near the important support zone of 1411.  After the November bottom, the market suggested a "safe" target zone of 1445-1455 which it reached -- but since then, the market has kept its options open.  There is no clear answer just yet as to what its intentions are, but it is worth noting that it found a top within 1 SPX point of my bear count's expectations, then reversed solidly  Accordingly, objectively, I'm forced to give the bearish count equal weight for the time being.

Elliott Wave analysis is fractal-based, so when we work with it as a predictive tool, we're often attempting to anticipate the fractal that's being formed, in order to know where it leads.  Some fractals are quite clear and "high probability" interpretations.  Others are vague and need clarification through the market's next move.  This is one that could still go either way.

Below is the bearish interpretation of the fractal, and some keys to watch which will aid in clarifying what this pattern "is or isn't."


Next is the most straightforward of the bullish interpretations.


Since many fractals mimic others, I often look at related markets in order to try and gain insight and clarity.  I pay close attention to the currencies -- though the reality is that currencies are not always correlated to the equities markets, they are usually helpful clues.  It's generally a decent bet that a falling dollar equals inflation, which typically means higher prices in dollar-denominated assets, such as equities.

The US Dollar hasn't quite "locked in" a bearish fractal, but it's come awfully close... so no "definite answer" yet here either.  The red wave 2 high is now key for dollar bulls to reclaim, while the red b/ii low is key for dollar bears. (continued, next page)

Monday, December 24, 2012

Is Santa Bringing Coal for the Bulls or the Bears?


Christmas Eve has arrived, and now the question is: who's going to get coal in their stockings?  The bulls and the bears have both held the key levels they needed to, in order to create maximum confusion over who will own the longer-term.  I have remained intermediate bullish since November -- and still continue to slightly favor the bulls for the time being -- but this is an important inflection point, and I'm prepared to switch footing if the market dictates.

The first key levels I'm watching are 1411 in the S&P 500 (SPX) and 13010 in the Dow Jones Industrials (INDU).  Sustained trade beneath those levels would leave the market vulnerable to a larger decline.

I've drawn up a lot of charts for this update, so we're going to get right into it.

The first chart I'd like to share compares the SPX, the German DAX, and the London FTSE.  These European markets are one of several reasons I continue to give a slight edge to the bulls on this side of the pond.


Next is the SPX bull count, which is facing a test, since my mid-term target of 1445-1455 was reached and the market immediately reversed lower.  Bulls need to claim that resistance zone in order to clear the way for new multi-year highs.  At this point in the wave structure, trade above 1448 should lead to a very bullish resolution.


Below is the 30-minute view of the same count.  Note MACD is in the process of a bullish crossover.


As noted, this remains an inflection point for the larger picture, which means the structure hasn't closed itself to the bearish potential.  Below is the bearish interpretation of the fractal.  The bulls will become more vulnerable if the market sustains trade beneath 1411. (continued, next page)

Friday, December 21, 2012

Congress Tries to Push Santa Off the Fiscal Cliff


Last night was an interesting night to be a futures trader.  Congress announced they didn't have enough votes for "Plan B" to avert the Fiscal Cliff, and the E-mini S&P futures (ES) promptly dove 50 points into limit down.  As of the time of this writing, ES is trading about 20 points in the red.

Congress has announced they're now going to do some work on Plan C, which stands for Christmas, and are thus headed home for a much-deserved holiday break after yet another grueling week of endless yapping.

Last night, even though Congress people were fleeing the hill like ants, I managed to corner one on his way out the door.  He agreed to a brief interview, on the condition that I allowed him to remain anonymous.  I acquiesced, and asked what the next plan was.

He replied, "A year ago, we coordinated with the White House and worked out a fool-proof fallback plan to avert the Fiscal Cliff.  We'll be implementing that plan immediately."  Excited, I followed up and asked for more detail.  "It's really quite simple," he replied, "According to the Mayans, the world is supposed to end today -- so we figured, why bother with budgets?  We're only sad that we didn't spend more."  When I asked what the plan was in the event that the world didn't end, the Congressman smiled vacantly and edged rapidly out of the room.  

I plan to follow up on this if we're all still here tomorrow.

The question now is whether this Fiscal Cliff plan failure will this preclude the Santa rally I've been expecting, and the answer is: I don't know yet.  I do know that the cash charts can tolerate a drop in the ballpark of the current futures levels, and still maintain their bullish bias.  In fact, a move such as that would be completely reasonable, as shown on the S&P 500 (SPX) chart below:


I am, in fact, still inclined to give bulls a slight edge, but the real questions won't be answered until we see how the cash market reacts to this news.  I will add that it's a little bit bothersome that this happened right after my November target zone was reached, as target zones are also higher-probability reversal zones.


The SPX bearish wave count is still alive and well, even though I began discounting it back in November.  The SPX structure appears to pivot on the 1411 price point. (continued, next page)

Wednesday, December 19, 2012

SPX, RUT, NDX: November's Upside Targets Captured, and a Look at the Long-Term


Last update expected the rally to continue.  The market obliged and, in the process, finally reached my standing mid-term target zone (from November) of 1445-1455.  So far, everything looks reasonably good for a trip toward the next intermediate target of 1490 +/-, but if things seem to be shifting back into the bears' favor, I will try to note that in these updates.

In this update, I want to cover a couple of long-term charts, to try and see where we might be in the big picture.  The Russell 2000 (RUT) is of particular interest, because at least two of the waves which make up this structure are as close to "unequivocal" as one can ever find.  On the chart below, red wave i is a pretty clear ABC (or it's I-II, i-ii -- see chart).  Further, the wave labeled as red wave iii is almost certainly a corrective wave, which narrows down the pattern options significantly.

If we assume that both i and iii are not five wave forms, then we are left with two fairly high probability patterns:  one is called an ending diagonal; the other is a bullish nest of first and second waves.

An ending diagonal consists of five corrective waves, and suggests this is a market in the final thrust upwards before a large, long-term correction unfolds.  One nice feature to this pattern is that there is a clear invalidation level: 902.30.  Above that level and the 1-2 nest becomes higher probability.  Because 1's and 2's lead to third waves (usually the longest and strongest waves), trade above 902.30 would make the pattern ragingly bullish (starring Robert DeNiro), and suggest a market on its way to a long-term nosebleed rally.  Both potential target zones are noted on the chart. 

I believe the key to sorting the two patterns out is red wave iv.  If that wave is wave-c of a running flat (the mega-bullish pattern), then it should be impulsive (five waves down).  It appears to be corrective (an ABC), which instead fits the ending diagonal pattern; therefore I'm inclined to give that pattern a slight edge.  Both patterns are intermediate bullish, so it's something of a moot point at the moment -- but we'll keep an eye on this going forward.


Next is the long-term S&P 500 (SPX), which sports a similar wave structure.  The key long-term bull level here is 1551.11.


Since the market has performed in line with the preferred bullish intermediate wave count all month, I'm going to focus on that count until the market says I shouldn't.  The chart below details the bull count, and notes the alternate bear count.  The bear count would find a top soon, but there's really nothing to yet indicate that we should be looking for anything other than a minor top.  The caveat is that although the bull count continues to appear quite probable, do note that my November target zone of 1445-55 has now been reached, and thus an added level of caution is in order.  Traders may want to raise stops to protect profits. (continued, next page)

Tuesday, December 18, 2012

Here Comes the Santa Rally


Yesterday's update was unabashedly bullish across all time frames.  I noted the market was likely to find a bottom directly, and wrote, "I am currently viewing the decline as a complete, or nearly complete, c-wave lower to wrap up yet another second wave.  This suggests a strong rally is waiting in the wings."

While I felt I conveyed my bullish stance quite clearly, I later realized that I had neglected to detail (in plain English, anyway) exactly what I was seeing in the charts that caused me to turn bullish at Friday's low.  I sometimes forget that, to those just learning Elliott Wave Theory, the whole thing can seem slightly more complex than trying to build a fully-functional suspension bridge entirely out of Spam and nachos. It has a language all its own -- but I use that language so often, I sometimes forget that readers don't necessarily understand what the heck I'm talking about.

So in this update, I'm going to discuss what I saw on Friday, why 1420 lost its significance for bears, what I'm watching going forward, and why.

One of the main markets that's given me the bull bug is the Nasdaq 100 (NDX).  Yesterday, I wrote:

The NDX has formed a fairly clean five wave rally off the November print low, and that does suggest trouble for bears.  It's also now in a zone where a meaningful bottom could form.  If the count shown below is correct, this represents a low-risk buying opportunity with the potential for a great deal of upside.

Hopefully, some readers took advantage of that low-risk entry.  First let's take a look at the chart (for those following along at home), then we'll discuss why I wrote yesterday's paragraph and what it means to traders.  I've added a number of educational annotations to this chart, to help detail my views.


There were two simple logical conclusions that led me to view this chart as quite bullish.  In Elliott Wave, five wave rallies move in the direction of the larger trend, and they cannot exist in a vacuum (in other words, you must pair the five-wave rally to the rest of the pattern; it cannot stand alone).  So The first factor in my analysis is the five-wave rally off the November low.  That leads me to the conclusion that the market must complete at least one more five wave rally in the upward direction (at the minimum).  Two five wave rallies, separated by a corrective decline, complete an ABC.  Three five-wave rallies, separated by two corrective declines, complete a larger impulse wave (a larger five-wave form).  One five-wave rally cannot exist on its own in this position, so the rally from 2494 to 2699 must be considered as Wave-i or Wave-a.

Next, I zoomed in on the smaller time frames and counted five-waves down from 2696 to 2620, and that led me to another conclusion:  if that decline is only the first wave down and not the end of the correction, then it appeared likely that the decline would ultimately retrace beyond where the larger Wave-i/a began at 2494... and that would break a cardinal rule of Elliott Wave, which says the correction to the first five-wave rally (the correction is called Wave-ii, or Wave-b) cannot retrace beyond where the rally began.  This led me to the conclusion that it was quite likely the entire downward correction was over.

At this point, trade below 2620 would create a problem for that outlook, so that's the key level to watch for anyone who positioned long at yesterday's open.

The room for error lies in the fact that the market rarely forms "perfect" waves -- so it's always possible that my interpretation of Wave-i/a as a five-wave structure is incorrect.  If it's not a five-wave rally since the November low, then the above points are moot, my preferred outlook is wrong, and the market is free to decline below 2494.

For now, we're going to assume that my interpretation is correct.  Let's take a look at NDX daily to illustrate why NDX probably presents a problem for SPX bears.  The bottom line is, it appears likely that NDX is headed to another rally leg of at least equal length to the leg from the November lows.

And if SPX follows suit and builds another rally leg of equal length to its previous leg, it will break above 1474 -- which then takes the bear count completely off the table (because of the retracement rule discussed regarding the beginning of first waves).


The next chart I'd like to examine, partially for educational purposes, is the S&P 500 (SPX) bearish wave count.  The scenario shown on the chart below is not my preferred read on the market for the intermediate term -- it's my first alternate outcome if I'm interpreting the higher degree wave structures incorrectly (in other words, if some of the waves I'm viewing as five-wave moves are actually three-waves, and/or vice-versa -- as I noted, the market rarely forms "perfect waves" and the majority of the work is left to the analyst to uncover and interpret).

Again, the market finds itself in a position where the bull and bear counts are both pointing in the same direction (up) presently, and this count also suggests higher prices still to come.  Bulls do need to break the 1438 swing high to confirm -- hence the black "alt: (1)" annotation.

Now to cover why the market dictated this chart be adjusted in-between Wednesday and Monday.  The overlap at 1420 created an issue for the old bear count -- which depicted a higher-degree c-wave rally -- and that issue is based on the fact that c-waves are always 5-wave moves.  Within those 5-wave moves, waves 1 and 4 cannot cross paths (except in special cases, called ending diagonals).  An ending diagonal appears highly unlikely, based on the shape of the move.  So once the potential wave 4 moved into the price territory of wave 1 (below 1420), that told us the c-wave was off the table, and I changed the labels to reflect the next highest probability bear pattern.  I have adjusted the labeling again slightly since yesterday (since the bear outlook remains my alternate, I am not really focusing on this chart in most updates).  (continued, next page)

Monday, December 17, 2012

SPX and NDX: Will Bulls Seize This Opportunity?


Wednesday's update noted that the market was approaching an inflection point, and to watch the SPX 1440-1455 zone for signs of a reversal.  Later in that same session, the S&P 500 (SPX) reached an intra-day high of 1438.59 and reversed strongly.  This is again a very interesting position for the market, because the decline has unfolded in an apparently impulsive fashion, and can now be counted as five complete waves down.  Normally that would suggest at least one more leg lower, of at least equal length -- but I have my doubts for a number of reasons, and suspect the market may find a bottom fairly directly.

I am currently viewing the decline as a complete, or nearly complete, c-wave lower to wrap up yet another second wave.  This suggests a strong rally is waiting in the wings.  I'll cover a couple reasons for this view, beginning with the SPX chart below.  I'll caveat with the note that this is a very vague wave structure on SPX, though, so the possibility does exist that a larger decline is beginning.  Once the market sees its first decent bounce and retraces somewhere in the 50% zone, we'll be able to consider the prior swing low as important to the near-term bull case.

The chart below is the interpretation I'm presently leaning toward, and suggests a bottom fairly directly, followed by a strong rally to new highs.


Examining the hourly chart yields a slightly different perspective on the alternate potential.  The odds favor that bulls will find a bottom directly, but if they can't, then the shape of the previous rally would force us to consider the possibility that the present decline is part of the larger wave (2) which could retrace 50-62% of the total rally.


While I'm favoring an intermediate bullish resolution, the bears do still have hope.  I've noted 1434 as the key bullish pivot for some time, and the market was unable to sustain trade above that zone, which keeps bears in the running for the time being.  Accordingly, I'll update their chart with the bear potential.  While I still consider bears the underdog here, the market always reserves the right to change my mind. (continued, next page)

Wednesday, December 12, 2012

SPX, INDU, BKX, and US Dollar: Market Approaching a Key Inflection Point


Last update (Friday) noted that trade above 1416 would suggest a first target of 1422 and a second target of 1433.  Both targets have since been reached, amounting to 17 points of profit.  Of note, the S&P 500 (SPX) exactly tagged (to the penny), and reversed from, my "critical bear level" of 1434.27.  It remains to be seen if bulls can sustain trade above that zone.

I am continuing to give the edge to the bulls for the intermediate term, but the SPX has reached/is reaching another interesting potential inflection point.  Since November 29, my standing target for SPX has been 1445-1455, and we've come within 11 points so far.  This is a zone bears may attempt to defend, so longs should stay nimble going forward.

Beneath us, I would watch the 1420 area as the first important support zone, and sustained trade beneath that zone would serve as a warning to bulls, at least over the short-term -- with the possibility of a more bearish intermediate outcome.  Until then, as long as bulls maintain that support zone, the market is cleared to keep moving higher.

The next two charts help outline the importance of this inflection point, and the outcome here will help define the bigger picture.  According to Elliott Wave Theory, the market moves in three-waves when it's moving opposite to the direction of the next larger trend (correcting), and in five-waves when it's moving with the larger trend.  I'm continuing to favor the bulls for the intermediate-term, because the decline from 1474 counts better as a three-wave move, which suggests it was a counter-trend correction to the long-term uptrend -- but it's still not a clear-cut picture, and thus both possibilities remain valid.

The first chart is the bullish count, though it's important to keep in mind that there are different paths the market can take to reach these targets -- and very few markets move in a straight line.  I try to adjust the projected paths when possible and as needed.

PLEASE BE AWARE OF THE TYPO ON THIS CHART, WHICH SHOULD READ: "I'd more strongly favor the BLACK count with sustained trade beneath 1420."


The next chart shows the hourly count when viewed through a bearish lens.  The bears want this to be a three-wave rally (an ABC), which would make it a correction to the prior decline.  Bears will need to make a stand soon to maintain their hopes, and the market has almost reached the zone where a corrective rally could expect to be rejected.

The chart below depicts an ending diagonal (c) wave.  A related option, not shown on the bull chart above, is that of a leading diagonal first wave, which would play similarly over the short-term.  A leading diagonal or ending diagonal would make one more quick thrust up before a strong reversal toward 1385-1400.  The difference between the two is that the leading diagonal would still be intermediate bullish, and march higher after that decline.  Thus, we should watch the 1440-1455 zone carefully for any signs of reversal -- the chart below notes some signals to keep an eye on.


Those are the caveats for bulls regarding the current price zone.  The caveats for bears are different.  One problem for bears, as I see it, is that once the market sustains trade above 1434, we're back into a thinly-traded range (between 1434 and 1464), and there may not be much in the way of resistance until the upper edge of that range.  This would jive with the bullish interpretation of a third wave higher (blue (3)) underway.  Third waves are pure trending waves, and are unforgiving of traders who cling stubbornly to wrong-sided positions.  

Looking down the road a bit: If the market can get through the congestion zone, then we reach the old resistance zone from 1464-1474.  The market was rejected from that zone on three prior occasions.

There's an old trading adage that says, "The more often resistance (or support) is tested, the stronger it becomes."  My belief is the exact opposite:  "The more often resistance (or support) is tested, the weaker it becomes."  The logic behind my statement is that with every trip into resistance, more selling is exhausted.  With every trip to support, more buying is exhausted.  Eventually, the market chews through all the sellers or buyers in a given zone, and then simply breaks through and runs.

Moving back to the charts, the Dow Jones Industrials (INDU) briefly overlapped its key bullish pivot, then reversed from that zone.  When we look at this chart, we are again confronted with the three-wave rally into the 13367 print high (the "tell" I noted way back on October 8) -- and thus I have to continue giving decent odds to the view that new highs beyond 13367 will be reached over the next couple months.  Bears have work to do if they want to change that viewpoint. (continued, next page)

Monday, December 10, 2012

Publication note...


My apologies, but unfortunately, this week my schedule is largely filled with some very time-consuming personal matters to attend to -- so publication for this week will be spotty.  Trade safe.

Friday, December 7, 2012

SPX Update: Just the Short-term, Ma'am


Last update noted that the rally might be due a breather, but the price action since has been inconclusive.  I get bugged when I can't reconcile the charts at the 5-minute time frames and below, and that's the case right now.  The 5-minute SPX chart makes sense in two contexts, but the contexts are diametrically opposed from each other.  Basically, either my last read was correct and the market is forming some kind of screwy expanded flat 2/b (blue), or it's just completed the first wave of a new leg up.  The expanded flat makes more sense in the context of the price action that came before, but it just doesn't quite jive with the move since 1415.

I pretty much despise nights like this, because I've now spent roughly 7 hours charting, but feel like I have little to show for it.  The chart below discusses a few levels to watch, and some potential targets, but I'm hesitant to get too married to anything here.  Stay nimble if you try to trade this mess.


Next is the INDU chart, which performed well per the last update and came within a few thousands of a percent of reaching the first target -- but the wave seems to have become more complex.  The interpretation below jives reasonably well with the blue SPX count above -- so maybe my sense of frustration is misplaced... it's always possible I've got this reconciled perfectly and the market will perform exactly according to plan.  As I said, though, stay nimble here.


In conclusion, last update I warned about the possibility of a confusing and frustrating trading range forming, and that may well be what's going on.  A clear break of the range (especially on INDU) should help lead the market into more clarity.  Trade safe.

Reprinted by permission; copyright 2012 Minyanville Media, Inc.

Wednesday, December 5, 2012

SPX and INDU: Rally Due for a Breather?


Monday's update expected the S&P 500 (SPX) to head toward the 1426 +/- level, and noted that price zone should be watched for a possible turn.  SPX reached nearly 1424, and then reversed into a 20 point decline.  That decline does appear to have been impulsive, but there are presently two equally viable ways to fit that impulse into the surrounding structure, as shown on the chart below.  The chart also notes a pending bearish sell trigger if SPX sustains trade below 1403.


This has been a pretty sloppy market for the last couple sessions, and try as I might, I cannot yet reconcile the rally from 1385 as an impulse wave (a five wave move).  This means it's either incomplete and will head to new highs (black, below), or it's the b-wave of a larger expanded flat (shown below in blue), which will culminate in a decline toward 1384 or lower.  Sustained trade below 1400 would more strongly favor the expanded flat.


The next chart shows why I slightly favor the idea of a larger correction here.  SPX, RUT, Nasdaq, and NYA have all back-kissed the underside of major trend lines, and it would be unusual for them to simply power through without more of a pause. (continued, next page)

Monday, December 3, 2012

NYA Update: No Material Change


Just a quick update tonight since there's not much to add to yesterday's comments.  I spent a lot of time charting tonight, but have selected to share just one chart for the sake of illustrating the point.  Below is the NYA, which suggests bears aren't out of the woods just yet.  I'm sharing NYSE Composite (NYA) because the apparent triangle in SPX doesn't work on this chart (nor does it work on INDU -- see yesterday's short-term SPX chart) -- this is because the wave which would be labeled as "e" in the triangle (8235.23) exceeds the apparent "c" wave bottom (8235.89), which invalidates a triangle for this index (which, in case you forgot, is the NYA). 

The rally into yesterday's high appears to be only three waves, at multiple wave degrees.  In other words, the main question this chart poses is: higher prices now, or higher prices later?  Watch the invalidation levels for clues. 


Note the future wave notations aren't intended to be time-accurate -- I'm simply working in the available space of the chart.  Trade safe.


SPX Update: December Means It's Time to Start Throwing "Santa Rally" in the Title...


Will bulls get their Santa Rally?  Let's look at the evidence...

Last update noted that some new intermediate buy signals had triggered and expected that the rally still had/has further to run.  Friday appeared to be a triangle consolidation, so there's been no material change, and I still expect higher prices -- however, I have spent some ongoing time deciphering long-term charts (somewhere in the neighborhood of 400,000,000 hours during November), and believe I may have finally unlocked the intermediate wave structure.

When the correction first began in September, I was initially viewing it as a fourth wave decline -- largely because the structure appeared to need a fourth wave, and most of my indicators suggested that 1474 was unlikely to mark a major top.  But then the decline continued past the fourth wave invalidation level, and that raised questions for the bulls -- however, all throughout the decline to 1343, I continued to feel that the decline was most likely a corrective structure (meaning new highs are/were still out there for this market).

Without further ado, here is the S&P 500 (SPX) chart which I believe unlocks the intermediate structure.  If you're new to Elliott Wave Theory, the most basic concept is that the market moves in five waves when it's headed in the direction of the next larger trend, and in three waves (or combinations thereof) when it's heading against the next larger trend.  I believe the rally counts best as five waves, and the decline from September counts best as two three-wave structures.  This would mean the long-term trend is still "up."

I've been giving a slight long-term edge to the bulls for a while, and while the market hasn't yet reached the point where we can say the bears are out of the running, unless the market starts declining in a true five-wave impulse, I think we have to give serious consideration to the wave count shown below.  Note that the decline found support almost exactly at the 61.8% retrace, which is perfect for a second wave decline.  This count suggests the market is on the cusp of a massive rally -- a third wave up at Minor degree.  About mid-way through a third wave, the masses recognize what's happening and jump in -- and momentum continues in a relentless fashion.

I'm still not ready to say this count is "the one" -- but my gut likes it a lot.  Now it's up to the bulls to prove it with some key level breaks (noted later).


Zooming in a bit, the count below currently appears to be the most viable short-term interpretation:


And zooming in even more, here's an attempt to break down the smallest waves, along with a whole bunch of info on some key price points.  1426 +/- should be watched as a possible turn level. (continued, next page)