Calling tops has always been a difficult endeavor in market analysis, and considering that for the past 12+ years we've been in a historic bull market driven by unprecedented Fed intervention, it's that much harder now. While I may have jumped the gun just a little very recently, some people (or maybe it's just one person) seem to have forgotten that -- to cite only one example -- in 2020, I believed we would crash, but also believed that was "only" a large fourth wave, and thus destined to recover to new all-time highs. I mention this mainly because a certain troll recently claimed "this analyst has been saying the same thing for a decade" (implying that I'd been bearish for a decade), which is so wrong that it drifts into the realm of outright stupidity.
(I won't even go into my call for a long-term and massive bull market back in January 2013 -- most veteran readers know that I've been on the right side of this market more often than not.)
Anyway, in a moment, there's a market-relevant point that I'm going to make about the following charts -- but first, here's the INDU chart I published on February 26 of 2020. Note the (4) label and the line headed back up to new all-time highs from there:
Here's the SPX chart I published in March of 2020; again, note 4 is followed by new highs in 5:
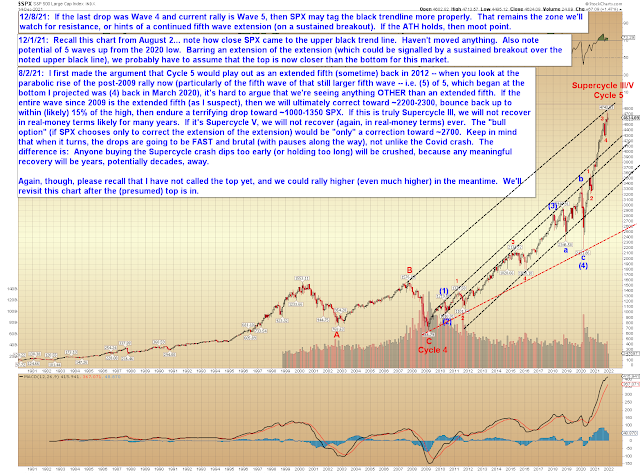
Now, here's the "market point": The Covid crash was a pretty clear fourth wave. That means we have almost-certainly been riding out the fifth wave ever since.
And the fifth wave is the final wave of a move -- which, now that we're finally getting into a potentially-complete wave structure, means we're likely approaching the end of the 12+ year bull market.
What we're currently trying to nail down is whether the fifth wave of the fifth wave of that larger fifth wave has completed or not.
Read that again.
As I mentioned last update:
Even if SPX manages to make a new high, that will probably be the fifth wave, and (barring an extension) is thus reasonably likely to be followed by a correction (or worse) anyway.
In other words, even if SPX manages to make a new all-time high, we are probably into territory where we should be considering selling the bounces.
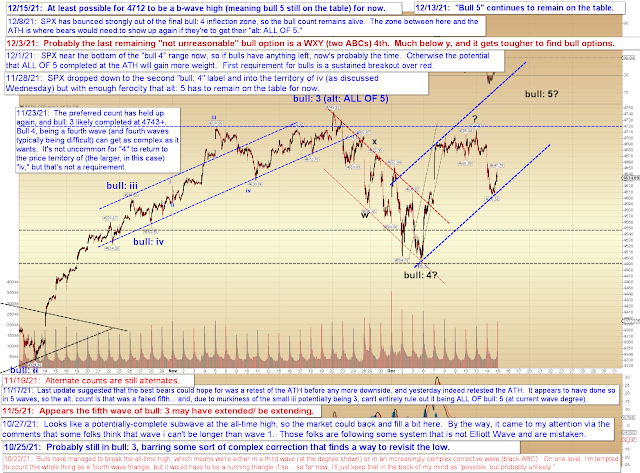
Let's look at the near-term chart first, with the emphasis that "bull 5," even if it shows up, could very well be the final high of this 12+ year bull market.
Of course, if that final fifth doesn't show up, then we might have already seen the all-time-historic-high.
Let's look at the old intermediate term chart of NYA next. Worth noting that NYA recently captured its 17,000+ target (published 8 months ago):
So that's the bear case, but what are the remaining bull hopes here?
Well, their first hope would be for an "extension of the extension." The rally since 2020 has been an extended fifth wave -- bulls would like to see the (presumed current) fifth wave of that fifth wave extend. That's always possible, but given that inflationary pressures are finally forcing the Fed's hand (per Powell yesterday), it's hard to imagine there's going to be enough fuel for that extension if the Fed follows through and indeed pulls away the punch bowl. If they don't, then that might be another matter.
But here's the nice thing: On the next chart, we'll look at a signal to watch that could tell us if the fifth wave of this fifth wave is going to extend. Thus, we can reasonably presume the fifth wave is ending here if that signal does NOT materialize.
So, on the chart above, in the event SPX sustains a breakout over the upper black line, then we might forget about selling the rallies for a while and watch to see if bulls can get an even-more-extended fifth wave. We can't yet rule that out, given that the fifth wave is short relative to wave 1 on that chart -- but nevertheless, I'm taking the approach of "making the market prove itself here," so if it doesn't break out, then we'll stick with the idea that the top is now closer than the bottom
Referring back to the NYA chart for a moment: The second option bulls have is for a more complex fourth wave (shown by black "or 4" and "or 5"), similar to what happened in 2020, but at a much smaller scale. We'll simply have to track that possibility as it unfolds -- but again, unless there's an extended fifth here, that potential wouldn't change the longer-term outlook too much.
Now, all that said, I would again like to emphasize that calling a top to the most powerful bull market in history is no easy task, so if you think the market is going to keep going up, then hey, you could be right. I could be wrong, or could be early, or whatever. Or the market could choose to extend the fifth of the fifth here, which no one can really predict. I can't promise anything, and nothing I publish here is trading advice; I can't manage your risk for you. That's what brokers are for.
All I know is that we just about tagged the upper boundary of the very long-term channel, we reached the long-term NYA target, we came within 6 points of the long-term SPX target, and there are roughly enough waves (give or take a couple micro waves) to mark a complete five-wave rally from the 2020 crash low.
Near-term, if bulls are going to get their fourth and fifth wave to new highs, then now may be the time. Longer-term, until the market dictates otherwise, I'm sticking with the idea that the top is closer than the bottom, and thus that it's probably not a bad time to take some risk off the table.
Trade safe.