Amazon

Showing posts sorted by relevance for query time to sell the bounces. Sort by date Show all posts

Friday, January 28, 2022

SPX Update: Other Than That

The market has remained stuck in a trading range since January 24, so there's little to add to the past few updates, except to note that I have examined some additional markets since then, and so I'll reiterate that I think any sustained new low will put the odds increasingly in bears' favor.  Meaning if that condition is met, it will become increasingly likely that the bull market we've been in since 2009 has truly ended.

Other than that, not much to add.  ("Other than that, Mrs. Lincoln, how was the play?")

Although I should mention that I noted in the forum during the session yesterday that, near-term, I suspect yesterday's low in SPX is a b-wave, meaning the market should break that low.


Note that SPX has, so far, been unable to sustain trade back above black (cue AC/DC):


In conclusion, while I spent most of December warning that it was "Time to Sell the Rallies," to reiterate: if SPX/ES sustain a break of this month's low, odds will increase that a true bear market has finally begun.  Here, I'd like to quote a bit from one December update:

Now, here's the "market point": The Covid crash was a pretty clear fourth wave. That means we have almost-certainly been riding out the fifth wave ever since. And the fifth wave is the final wave of a move -- which, now that we're finally getting into a potentially-complete wave structure, means we're likely approaching the end of the 12+ year bull market. 

What we're currently trying to nail down is whether the fifth wave of the fifth wave of that larger fifth wave has completed or not. 

Read that again. 

As I mentioned last update: 

Even if SPX manages to make a new high, that will probably be the fifth wave, and (barring an extension) is thus reasonably likely to be followed by a correction (or worse) anyway. 

In other words, even if SPX manages to make a new all-time high, we are probably into territory where we should be considering selling the bounces. Let's look at the near-term chart first, with the emphasis that "bull 5," even if it shows up, could very well be the final high of this 12+ year bull market.

Trade safe.

Wednesday, April 2, 2014

SPX and NYA Updates: Long-Term Resistance


Monday's update anticipated that the S&P 500 (SPX) was headed directly to new highs, and confidence in that view was added during Monday's session, when SPX broke, back-tested, and held 1867.  Tuesday's session closed at a new all-time high.

In today's update, we'll discuss the bull and bear cases and the zones to watch for each. 

On Friday, I wrote: "Due to the larger trend, this is probably bears' last shot to break these markets down, so any strong bounces from here would likely lead to new highs."  That now applies to bulls in reverse (sans larger trend, of course). 

If the market is indeed plotting the head-fake whipsaw I talked about on Monday, then we're likely to see a significant sell-off afterwards, as most traders will be caught wrong-footed.  This is because classic technical analysis would see a breakout here as very bullish, with targets in the mid-to-high 1900's.  After we examine the preferred count and the arguments in its favor, we'll also delve into those more bullish potentials in a bit more detail.

The preferred count continues to see this pattern as a triangle, which has either taken the form of a symmetrical triangle or an ending diagonal.  The pivot between those two options is 1887. 


Here's a more detailed look at the potential symmetrical triangle, using the NYSE Composite (NYA):


SPX reached the key 1885-87 pivot yesterday, but in the event it sustains trade north of 1887, then the symmetrical triangle is in play.  Interestingly, the textbook target for the symmetrical triangle also represents a long-term resistance zone.

I think one of the goals of trading ranges is to wear everyone out -- and in doing so, ranges sometimes serve the function of making traders a bit sloppy afterwards.  While the range is underway, everyone becomes hyper-focused on the near-term charts; then some feel thrilled or relieved when the range finally breaks.  Trend followers sometimes even become strangely complacent afterwards, due to the emotional release of stored tension that was generated by the range.

But I'd suggest we stay alert even if there's a sustained breakout over the 1887 pivot, because we have resistance showing up on the long-term chart, right near the symmetrical triangle's target zone:


So, put simply, the preferred count currently still anticipates that the new highs will turn into a head-fake and whipsaw -- but let's talk about the more bullish option as well.

Prior to the development of the apparent triangle trading range, I had been viewing the bull potential as wave i-up of v-up complete, with the correction as ii-down of v-up (now also complete), and iii-up of v-up still to come.  The series of apparent three-wave moves which created the trading range gradually drew me away from that wave count.  At the moment, I'm no longer favoring it -- but because three-wave moves aren't always what they seem, my original bull count isn't dead and I still have to continue to respect as a viable option.  That option will likely regain favor as the preferred count if the market sustains trade north of 1914. 

In conclusion, the preferred triangle count accurately predicted the end of the trading range and the immediate new highs, which gives some additional credence to that count.  Of course, we don't want to get too far ahead of the market or too rigid in our expectations, but the pivots continue to bear watching as potentially-important reversal zones.  For the time being, I'm continuing to favor the view that the anticipated new highs are part of a terminal pattern.  Trade safe.

Follow me on Twitter while I try to figure out exactly how to make practical use of Twitter:
 @PretzelLogic


Reprinted by permission; Copyright 2014 Minyanville Media, Inc.


Friday, June 22, 2012

SPX Update: Rally Likely Over -- Ready for the 1100's?

With Thursday's solid decline, it's likely that wave (ii) ended at 1363.46, about a point and a half shy of my target zone.  In my defense, it appears that the final fifth wave up most likely failed, which accounts for the target short-fall.  There is one last short-term hope remaining for bulls, but it's lower probability at this stage -- I'll cover that option in a few moments, but first, let's take a look at how my Elliott Wave analysis is doing overall for the intermediate picture.

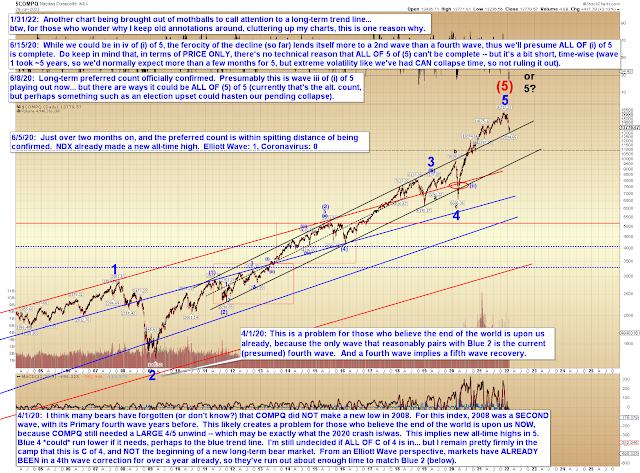
Below is the preferred count I published on June 1.  The decline fell 6 points shy of my target zone (and the red wave (ii) illustration here was never meant to be anything other than a rough guideline) -- but overall, it's probably safe to say, "not too shabby."  This is one reason I stick with Elliott Wave as my go-to analytical tool:  I simply know of nothing else that can call two intermediate turns this accurately before the first turn has even happened.


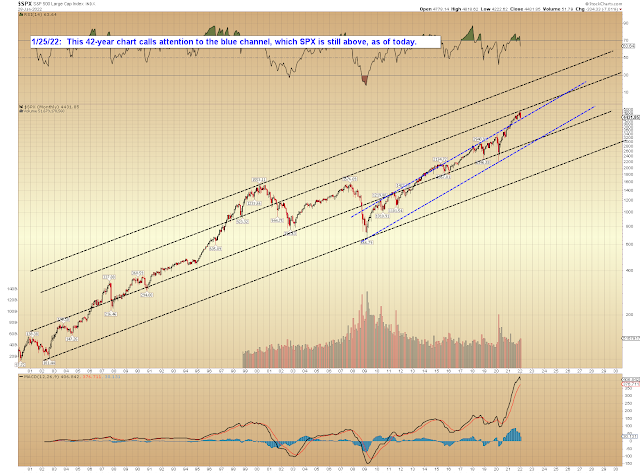
Let's update that hourly chart, add in some more clutter, and see where we are now in the intermediate picture.  My wave (iii) targets have been slightly adjusted from the June 1 chart.  Bear in mind that the market is a living, breathing, dynamic environment -- so further adjustments will likely need to be made on the fly.


Next, let's zoom in a bit to the 15-minute chart.  I am uncertain if wave 3 has bottomed or not, so don't bank on that wave 4 bounce -- instead watch the red dashed trendline in the one-minute chart (shown next).  My best guess is that 3 has reached a possible very short-term bottom (or nearly so), based on the one-minute chart, but it's not entirely clear.  Yesterday's 18 point bearish trade trigger target (which I've removed from the chart) was easily reached during the session.


Below is the one minute chart.  These can be extremely tricky to interpret and my confidence in this particular instance is only medium.  The chart does note the invalidation level for the bearish wave (4) interpretation (1347.39). 

Again, don't necessarily bank on that wave 4 bounce here.  As long as the market stays below the dashed red trendline, bears have no reason to fear anything; breaking that trendline is the first step for bulls to get something going.


Next is an indicator chart I haven't had the opportunity to share since late last year.  This indicator combines the readings of TRIN (a breadth indicator) with the down volume to up volume ratio (which indicates selling pressure), and shows that when the two indicators reach the signal line in concert, it becomes extremely high probability that there will be lower lows made in the near future.  This fits with my interpretation of the wave structure, but it's always nice to have some additional confirmation.

By the way, the last time I referenced this indicator (December 2012), it failed to work!  I don't think that will be the case this time, though -- the odds are definitely against a second failure here, so there should be lower lows in the market's near-term future.


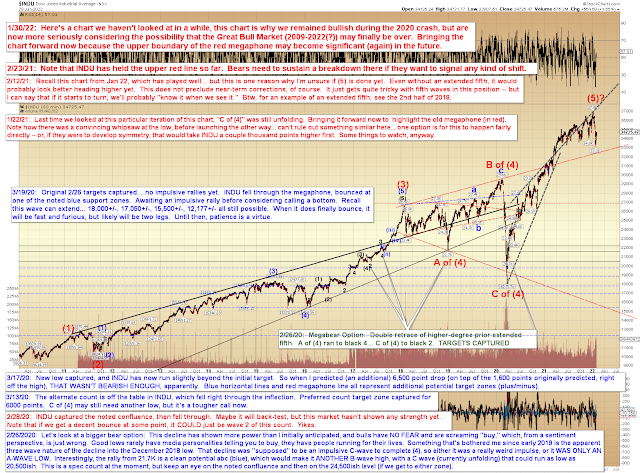
Finally, I do want to outline an alternate intermediate possibility.  This potential is lower probability, but there's no way to rule it out yet.  The strength of the decline was fully appropriate to kick off the assumed third wave, so there's currently no reason to to think a double-zigzag will develop here -- but we'll stay alert to this going forward.

The main purpose of the chart is actually to outline the very bearish 190 point sell trigger which will be activated with a breach of the lower dashed blue trendline, but I figured I'd save space and annotate the alternate count onto this chart too.  The bearish sell trigger also jives with the idea of a third wave down.  My preliminary target zone for the larger third wave is 1120-1130, but that would not mark the entire wave down -- there would still be a fourth and fifth wave, which, if correct, should allow the market to reach the trigger target in the high 1000's.


In conclusion, it appears reasonably likely that the market has begun the expected third wave decline.  Third waves represent a "point of recognition" for the masses, and they tend to be strong and unrelenting.  Discounting the alternate potential for a moment: if this is indeed now wave (iii) down, then bounces will often come late; upside targets for bounces will frequently fail; oversold indicators will reach deeply oversold conditions and stay pegged there; and declines will run deeper and faster than most think they should.  Trade safe.

Reprinted by permission; Copyright 2012, Minyanville Media Inc.

Monday, January 31, 2022

INDU, COMPQ, SPX, and a Whole Bunch of Interesting Data

The near term charts remain messy, so we're going to continue focusing on the longer-term chart pictures.

Before that, though, I'd like to share some interesting data I've gathered from various sources over the past week, starting with this (below).  Almost half of the members of SPX, and 76% of COMPQ, have already experienced drawdown equal to or greater than 20%.  Almost half of the NASDAQ has declined 50% (or more) from its 52 week highs:


Next, retail investors have remained net buyers during the drop (this can be something of a contrarian indicator, since retail investors aren't considered "smart money"):


Next, a chart showing that the Federal Reserve's holdings of "Trashuries" is now almost a third of the total market:


Finally, company earnings guidance has turned negative for the first time since April 2020:


Let's move on to the long-term charts, starting with a "legacy" chart of INDU:


Below is another legacy chart, this one of COMPQ, which, unlike INDU, has already tagged its noted trend line:


SPX very-long-term trend line (again) below.  Are you sensing a theme here...?


Finally, the SPX chart that proved incredibly accurate at foreseeing the recent top:


Near-term, one possibility is that SPX is forming a fourth wave triangle.  I posted the chart below to the forum during the session on Friday.  This count is speculative at the moment, not a "prediction" yet, and would be ruled out if SPX sustains trade over 4453 (which, if it happens, could take SPX toward 4525 or beyond):


In conclusion, as we've seen across markets, there is support at (and a bit below, in one case) the recent lows in the form of long-term trendlines.  As long as bulls can hold those, then they at least keep hope alive for a continued bounce, and even for a last trip to overhead resistance (though I wouldn't hold my breath waiting for that; easy to get caught looking in a market like this) -- but in either case, as I preached throughout December, I believe this remains a "sell the bounces" market.  Trade safe.

Tuesday, September 27, 2016

SPX Update: No Material Change


No material change since last update, except to note that, as the prior update could only speculate would happen, the decline from 2179.99 does appear reasonably impulsive at micro degree.  Although I have outlined 2180 as the "level to beat" on the chart below, as also noted in prior updates, the all-time-high is more important from a technical perspective. 

Note that 2/B could potentially be complete at yesterday's high, so any additional rally is not guaranteed.


In conclusion, there's no change from the last few updates, and I am continuing to treat bounces as sell opportunities -- please refer back to Monday's update for the intermediate charts.  Albeit this is not an "ultra-high-percentage" bear pattern (as some of them are; protect yourself accordingly), but short still appears to be the higher-odds play for the time being.  Trade safe.