Amazon

Friday, December 12, 2014

Brief Update #2: COMPQ Canary Not Dead Yet


I intended today's update to be a comprehensive review of all things bullish and bearish, but my life got in the way and I had to deal with a personal issue.  Hopefully the "bonus update" on Thursday earned me a little bit of credit that can be applied toward today's unusually-brief update.

In any case, I promise a more comprehensive update for the weekend, but in the meantime, I think the COMPQ chart will continue to serve us very well in regards to sorting out the market's intentions heading forward. 

The implications of a breakdown in COMPQ would almost certainly carry, by extension, to SPX and INDU as well.


My apologies again for the short update at an important inflection point.  Hopefully, COMPQ will serve everyone well enough to get through today's session.  Have a great weekend, and trade safe.


Wednesday, December 10, 2014

Quick after-hours update -- COMPQ, Canary in the Coal Mine?


Today's preferred count in SPX was a miss.  COMPQ has, so far, held its key level and the standard ABC remains valid as long as it continues to hold.  But more importantly, this may continue to be the most helpful market for sorting out the noise heading forward:


Trade safe!

SPX, COMPQ, INDU: A Game of Inches

Monday's update was near-term bearish, with three downside target zones, but still bullish for an eventual new all-time high.  All three downside targets were captured and exceeded, and I probably did some over-thinking on Monday, due to all the options for the pattern.  Prior to that, my original concern had been that a more complex wave (4) could form and take SPX below 2049, and it now appears that may be exactly what happened:


A bit more detail on the 15-minute chart:


COMPQ performed right in line with expectations, and the A-wave was indeed a warning for the rest of the market, as originally discussed on December 5.


Let's step away from the near-term charts for a moment, and take a look at the big picture.  I updated this chart for everyone on December 1, but apparently I then forgot to publish it (!) -- so as far as the general public is concerned, I haven't updated the big-picture chart in several weeks.

This appears to be a game of inches for bulls right now, but ideally, I'd still like to see new highs in RUT and NYA  -- and, by extension, SPX (interesting to note that RUT was up 1.8% yesterday).

(continued, next page)

Monday, December 8, 2014

SPX, COMPQ, BKX: Near-term vs. Intermediate Term


Friday's market didn't perform the way a third wave should, and this has left a number of complex options open.  The charts might get a little confusing, so before we get into that, I'm going to give a brief synopsis of my thinking regarding the intermediate term:

1.  RUT and NYA have, so far, failed to make new intermediate swing highs.  Odds are good that needs to happen before a meaningful top becomes possible.

2.  SPY has been up seven out of the past seven weeks.  Over the past 18 years, this has happened seven times (go figure).  In 100% of those prior cases, the market formed, at best, a minor correction before making new highs.  In 0% of those prior cases, the market formed an immediate major top.

3.  Last week, we looked at an RSI top study.  Given the market's behavior in the past, it remains highly unlikely that any kind of final high is in place. 

4.  Therefore, while there is not yet enough pattern present to determine the exact depth of any (pending) near-term correction, I do believe it will simply be a correction, and resolve with new highs.

5.  I currently believe the odds are good for an intermediate correction to follow after the next rally takes us to (presumed) new highs -- but let's not put the cart too far in front of the horse...

With that out of the way, let's see if I can keep the charts from being too confusing.  We'll start with the simple news that BKX (one of several market I had noted) has finally broken its September swing high.  We're still waiting on RUT and NYA to follow suit.


BKX near-term, best-guess:


In SPX, the pattern is so complex that I can spot three different options immediately -- and, due to the larger wave lacking a clear structure, there is no high-probability way to differentiate them.

I went 'round and 'round with myself as to how to present this chart in a manner that wouldn't be incredibly confusing, and I eventually settled on leaving the wave labels off for sake of clarity, and simply highlighting the potential target zones.


Finally, COMPQ remains the fly in the ointment here.  I really want to view that decline as impulsive, yet it's difficult to reconcile COMPQ and SPX.  There are two ways they could reconcile:

1.  SPX was indeed an ending diagonal, and is aiming at the third target zone or beyond.
2.  COMPQ's impulsive decline was wave C of a nearly-hidden flat and the blue bull count plays out.


In conclusion, the near-term is up for grabs.  I only have a half-session-worth of decline to draw from, and the pattern leading into that decline is ambiguous at best, which makes it very difficult to draw a high-probability near-term target zone.  Intermediate-term, while nothing's impossible, market history tells us that it's unlikely that the final highs are in yet.  Trade safe.

Friday, December 5, 2014

SPX and COMPQ: SPX Validates Preferred Count; Here Are the Next Key Levels


On Wednesday, SPX validated the preferred count and made a new all-time high, good for a quick 23 points of profit.  Bears are getting very restless with the seemingly-endless rally that's been underway since October.  There are real fundamental concerns underpinning this restlessness: Oil is down 38% since June, the yen has continued to collapse, the dollar has continued to rally, and the economy has continued to be sluggish.

The issue, of course, is that we can't time the market using fundamentals -- all we can really do with fundamentals is frustrate and head-trip ourselves.  Think about how well fundamentals have worked for timing since, say, 2009.  Or think about how well they've worked during this rally.  Are the fundamentals significantly different than they were a month ago?  Not really.

Meanwhile, as we've examined here since October, the charts have yet to signal a meaningful top.  The technical approach vs. fundamental approach is working just fine -- so, as always, everyone is advised to forget about whatever is making headlines in the current news cycle (barring a true black swan event, of course!).

I think it's important to ignore news, because news tends to bias our expectations.  We hear something bad and say, "Oh, man, no WAY the market can rally with that going on!"  And then when it rallies anyway, we start to feel like we're obviously smarter than the market, since (we think) we know why it "shouldn't" be rallying.

And at that point, things get dangerous for us as traders -- because we become emotionally attached to certain outcomes from the market.  We become emotionally invested in those outcomes, partially because the realization of our hypothesized outcome would (ultimately, eventually, one day!) prove that we were, indeed, smarter than the stupid market.  We were right all along!  Back pats all around, and another round of government cheese for everyone!  Because we're probably broke from being so darned smart that we fought the market tooth and nail the entire time it was going against us.

So forget about the news.  To some degree, forget about the fundamentals, too.  Let the charts tell you when the world is finally getting wise -- because they will tell you.  Or they'll at least tell you that the possibility is there, if X and Y qualifiers are met.  Maybe you won't hit the exact turn perfectly to the penny.  So what?  What's 20, 30, 40 points, relative to a major turn?

With that out of the way, let's look at the charts.  First up is the SPX 30-minute chart. The option of a complex fourth wave remains on the table, but will not be considered further unless/until the market sustains trade below 2066.  The alternate count shown here is for yesterday's high to have marked wave (v) of an ending diagonal (shown as black "alt: (5)), and this is another reason for longs to be cautious below 2066.


Next is the 5-minute SPX chart.  Bear options begin to open up below 2066:


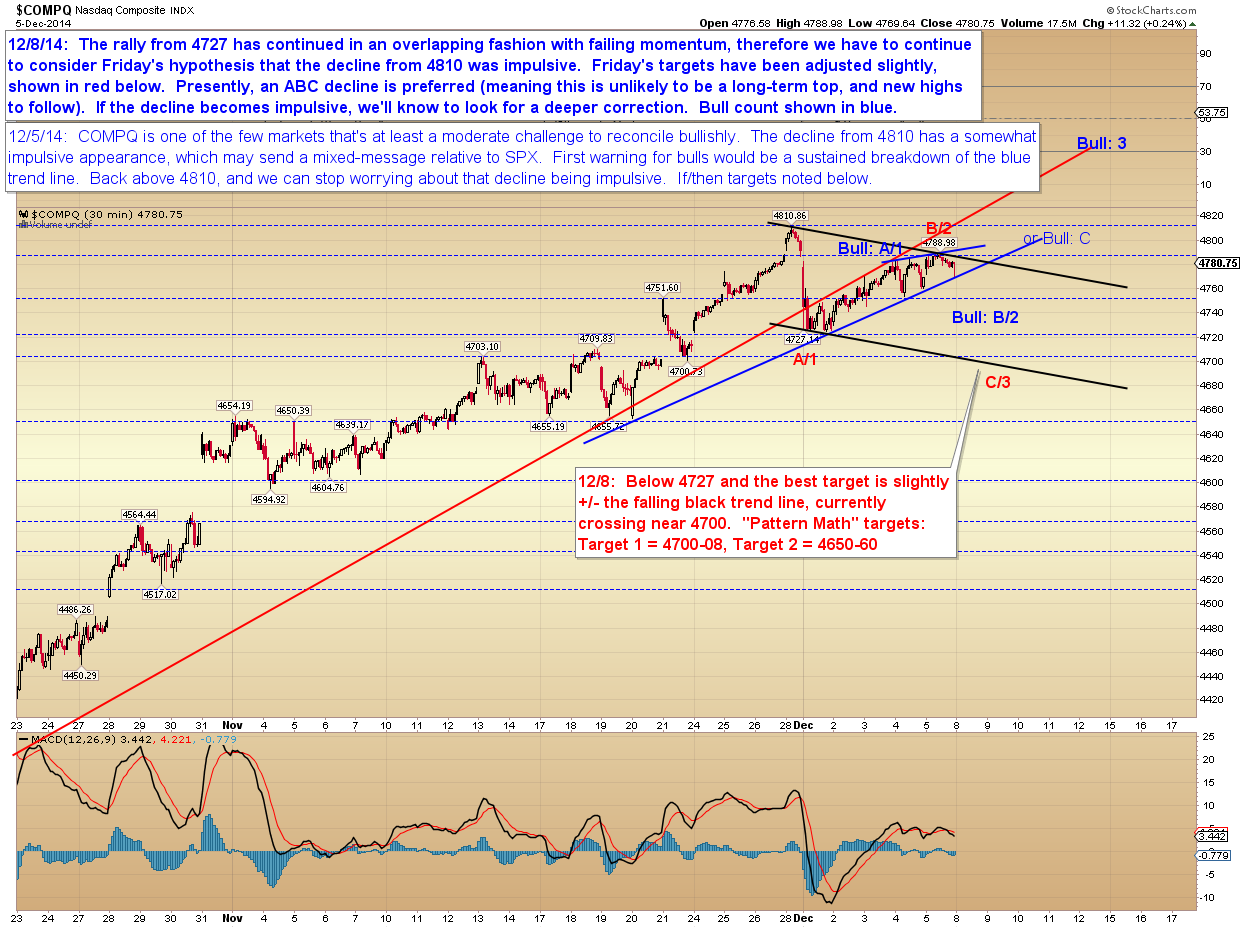
Finally, there is a fly in the ointment right now, and that's COMPQ.  COMPQ's decline appears to be impulsive, and unlike SPX and INDU, it has not made a new high since then.  This is one of the main reasons I'm continuing to give consideration to the possibility of a complex fourth wave in SPX, and also cannot eliminate the SPX alternate count from consideration.


In conclusion, trade below SPX 2066 does not guarantee a bearish resolution, but there is enough doubt across markets that such an occurrence would probably at least call for some near-term caution from bulls.  Conversely, as long as 2066 holds, bulls are golden for the time being.  Trade safe.

Wednesday, December 3, 2014

SPX, INDU, BKX: SPX Captures Targets, INDU Validates Preferred Count -- What Next?


Last update expected that the decline would prove to be corrective -- and by Tuesday, INDU had already made a new all-time-high, which validated the preferred count in that index.

SPX did not make a new all-time high, but did capture its preferred 2047-53 target zone, and subsequently generated a 19-point bounce.  No matter what happens from here, it's hard to complain about that outcome.

The question now is whether ALL OF wave (4) is complete.  Fourth waves are known for their complexity and unpredictability, so we have to stay alert to the possibility of a complex fourth.  This is best illustrated via INDU, as an immediate reversal lower from here would strongly suggest an expanded flat.  I'm going to keep the complex fourth as the alternate count for now, but this is a bit like saying, "I prefer the next roulette spin to land on black," since there's no law or rule that grants a simple fourth wave a serious edge over a more complex wave.

The upshot is that if there is another wave down immediately, then it will likely be a high-probability long play, because Monday/Tuesday's rally doesn't count well as a complete impulse just yet.


The main reason I'm preferring the roulette wheel to land on black for INDU is BKX.  BKX has overlapped its wave A low, and that means two things:

1.  It's probably an ABC decline.
2.  In the event it's not, then another wave down here could be very technically damaging.  Which doesn't really fit INDU's pattern for another wave down.  I suppose it's always possible for BKX to collapse as INDU is making new highs, but that seems rather unlikely.

I have to mention that because BKX has not yet overlapped the first wave in its current decline, there is still the potential for a marginal new low here -- it's just hard to see that happening with this current pattern.


And thus we come to SPX, which, as noted, captured its preferred target zone dead-center and rallied.  In fact, all I really had to do to complete this chart was move the c/(4) label about an eighth of an inch to the right (or 3.1750 mm, for our European readers)  Of course, accuracy of targets does not guarantee that the fourth wave thesis was correct, because I use a variety of tools to arrive at targets -- but it should at least have guaranteed a profit for nimble traders either way.

Due to the nature of fourth waves, and the lingering alternate count, I've noted the next potential targets in the event 2049 fails.


The main thing bothering me for equities at this juncture is that oil has fallen so far, so quickly.  This impacts some of the largest individual components of the major indices (such as Exxon and Chevron), and further impacts the banks who service those companies.  This can have a bit of a domino effect, and it remains to be seen if the price of oil will stabilize.  Interestingly, this could ultimately become one of the catalysts for the thesis I put forth in October that the current rally is a high-degree fifth wave, with a significant correction to follow.

Be that as it may, the charts still suggest we probably haven't seen an intermediate-term top just yet -- but they also suggest we may finally be getting close, at least in terms of price.  In a perfect world, I'd still like to see BKX, RUT, and NYA make new highs before it's all said and done, in order to complete fifth waves across the board.  In the meantime, in the event the market has more tricks up its sleeve, the first step for bears directly from here would be a breakdown at 2049 SPX.  Trade safe.

Monday, December 1, 2014

SPX, RUT, INDU: Bears Want to Know if We're There Yet, Bulls Want to Know if "Santa Rally" Will Appear in the Title


Let me start off by saying that I hope everyone had a good holiday weekend!  I apologize for the title's verbosity, but I was required by the Stock Market Writers Guild to put the term "Santa Rally" into the first title of a December article.  I don't pay those annual Guild dues for nothing!

Last update again called attention to the 2075 target from October, and SPX finally reached that price point... and reversed.  Bears want to know if this is it, so let's take a look at the evidence.  We'll start with a long-term daily chart of SPX:

 
I know this isn't what bears want to hear, but RSI history suggests this probably isn't the final top -- however, some backing and filling from this zone would be quite reasonable.

On the 30-minute SPX chart, I've adjusted the speculative wave count again.  I realize that I was previously looking for a top in the 2075 zone, and it appears we'll indeed get one -- but after studying all the available evidence (not shown, read: 50,000 other charts), I presently have some doubts as to 2075 being THE top.  That could always change as the structure develops, but a fourth wave looks like the more likely culprit at the moment.


Next up is a look at RUT, which probably still needs a new high to be complete.  This could suggest the fabled Santa Rally, which (and try to follow along here) the market has had every single year, except for the years it hasn't.


Next is INDU's daily chart, which I annotated so many hours ago that I no longer have any idea what it says.  Let's upload it and find out..! 

Awesome, it looks like it agrees with these other charts.


INDU's 5-minute chart notes a couple potential near-term targets (continued, next page):