Amazon

Monday, August 8, 2016

SPX, BKX, NYA, INDU Updates


Last update was on July 27, wherein I suggested that the rally was over-extended and due for some type of correction, minor or otherwise (I began suggesting this back on July 15, when I noted the market was bumping against resistance).  A correction did materialize, and captured its first downside target in NYA.  It then found support and bounced strongly:


NYA bigger view below:


INDU also found support at the first noted support zone:


As seen on the charts above, INDU and NYA have yet to make new highs from this bounce, but SPX has made new highs.  It would not be unusual to see an expanded flat develop in this zone, so watch the noted support levels on the chart below for clues.  Keep in mind that in the event SPX were to reverse lower immediately from current levels, odds would be decent that the next low would represent another buy op.


Finally, BKX is also still below its recent high, but (for the moment, anyway) still in the midst of a bounce from the lower boundary of its long-term trend channel:


In conclusion, my short-term top call from last month played out, but bulls held the first support levels across several markets, so there's nothing yet indicating an intermediate trend change.

On a personal note, I'm still in the middle of a big move, and may or may not be able to produce another update later this week.  As noted last update, hopefully things will settle down next week.  Trade safe.

Wednesday, July 27, 2016

SPX, OEX, BKX, and NYA: More Evidence the Rally is Overextended


The market has been in a holding pattern (also known as a chop zone) for the last couple weeks, illustrated well by BKX:


Some readers who are still learning Elliott Wave have asked about the qualifications for these waves, so the strict rules for a ZZZZZZZ wave are as follows:

1. The market MUST follow the most boring path imaginable.  Interesting moves invalidate the pattern.
2. Wave Z CANNOT be longer than Wave Z.   Although this seems self-evident, it is not.
3. Wave Z, on the other hand, can never be the shortest wave. Except during a full moon, and on weekdays whose names end in the letter Y.
4. The cheese stands alone.

On a more serious note, let's look at a few degrees of trend, starting with the near-term via NYA:


OEX may provide an additional clue, and suggests that there may still be more near-term downside coming:


SPX remains materially unchanged, but now there seem to be some near-term clues in other markets that indicate the path I suggested last week (toward at least the red "?") may come to fruition:


Bigger picture, BKX held the key level that I discussed at the end of June.  From an intermediate perspective, that's still the level bears need to get things going in a more significant manner:


In conclusion, last update talked about the message of VIX, and how it suggested the rally was overextended.  The current near-term pattern in OEX also seems to suggest that at least a near-term decline is pending.  Thus, barring a sustained breakout over the all-time highs in OEX, it appears that the next near-term move -- after this morning's opening pop completes -- is reasonably likely to be in the downward direction (although OEX is the canary, this directional move should apply to the broad market -- again, though, if OEX sustains trade over its all-time high, then we have to rethink that and simply accept the recent pattern as some lower-probability non-evident bull wave).

On a personal note, this may be my last update for about a week or so.  My family and I are in the middle of a move, and the next week to two weeks are going to be quite busy for us.  Time and internet connections allowing, I may try to sneak an update in here or there, but I can't be certain ahead of time if that will be possible.  At the absolute latest, things should return to normal near mid-August.  So, until the next update:  Trade safe.

Monday, July 25, 2016

VIX Suggests Rally Growing Over-Extended -- plus Gold at Three Degrees of Trend


There's very little to add to Friday's update regarding equities (please refer back to Friday's charts if needed), so in an effort to provide some "added value" to my readers, we're going to take a look at a chart I haven't updated in a LONG time:  Gold.

On the chart below, I discuss three degrees of trend in gold, and the apparent position of this market relative to each degree:


The chart below is most relevant to VIX -- but VIX is often relevant to equities.  This chart suggests VIX is bottoming, which by extension suggests that the rally in equities is probably getting over-extended:


In conclusion, while bulls could always continue powering forward indefinitely, it does appear that, while a bit more near-term upside isn't out of the question, the rally will soon be due for a pull-back.  Again, do keep in mind that there will almost certainly be buy opportunities again at some point in the future -- so don't get too focused on the (presumed) pending pull-back as the be-all-end-all.  Trade safe.

Friday, July 22, 2016

SPX, NYA, Oil: "So You're Telling Me There's a Chance..."


Last update highlighted NYA, and noted that the pattern suggested at least a near-term pause/decline was forthcoming after the next bounce, and that call turned out well.  Below is the updated chart:


As noted previously, SPX's recent rally bears some of the hallmarks of an extended fifth -- and there are now enough waves in place for the rally to be complete or nearly so, IF it's an extended fifth.  As also noted previously, if the rally is a third wave instead of a fifth, then we still need another decent rally leg.  I'm slightly more inclined to think it's an extended fifth -- but if that's the case, at worst, it could only support one more pretty minor high.  Any more than that, and bears really have no choice but to stand aside, or risk significant damage.


Also of note, oil has held the top I called back in early June.  So far, anyway.  Given that my oil calls are into a near-flawless streak that's measured in years, this is the point at which I ask myself if I should ONLY be trading oil and the heck with everything else...


In conclusion, if the recent rally was an extended fifth, then we may be on the verge of a reasonable decline, to at least back-test the 2100 zone.  Bears do need to remain cautious if the rally pushes much over recent highs, though, because there's no way to rule out the possibility of a third wave (as discussed above).  Trade safe.

Wednesday, July 20, 2016

SPX and NYA Updates

On Sunday night, I ended up missing a flight, and trapped somewhere without a computer, so I was unable to publish an update for Monday.  Given what the market's done over the past couple sessions, it doesn't appear that it would have been a critical update anyway.

Let's get right to the charts and start with NYA, because it shows a specific near-term pattern:


On the bigger view, recall that I mentioned (on 7/15) that NYA could encounter resistance in this zone, which it has.  Whether this will prove to be more than short-term resistance remains to be seen:


Moving on to SPX, the question on everyone's mind (including mine) is:  Is the preferred count of the past few months dead?  I attempt to address that on the chart below:


In conclusion, this is one update where the charts pretty much say it all.  Trade safe.

Friday, July 15, 2016

Market Update: NYA, INDU, BKX


There's not much to add in today's update, except to note that the long-term target of SPX 2170, from February 2013, was effectively captured yesterday (I think we can call 2168.99 "close enough" for a target that was published when SPX was trading at 1512).  Sometimes those targets, give or take a few points, function as resistance zones.  Let's get right to the charts.

First is NYA:


Next is INDU:


And finally, a quick look at BKX:


In conclusion, we've reached a minor inflection point, but given the ferocity of the rally to date, and the very small price range yesterday, it's difficult to say yet if the market will react to it much more than it already has.  If there's an extended fifth in play, then SPX would be expected to roughly track INDU, and the comparable breakout/retrace zone for SPX is 2100-2120 (if this doesn't make sense immediately, then please read this in light of the comments on the INDU chart for context).  Trade safe.

Wednesday, July 13, 2016

Market Update: A Look Back, A Look Forward -- and Why the Market Always Wins in the End


SPX officially made new all-time-highs recently, so before going further, we need to address the implications there.

First off, let me preface this by stating that this is not going to be popular with bears.  I realize that a lot of my readers are bears, but nobody should be trading with the "hope" that the market does something to justify their underlying bias.  The only reason to trade is to try and be on the right side of the trade in order to earn a profit.  If a trader is doing anything besides that, then they might as well just pile up all their money in the backyard and set fire to it, since that would ultimately be more fulfilling.

Or, heck, give it to charity or something.

I mention this for a reason.  In mid-late 2012, I began to turn bullish; then, starting with my very first article in January 2013, I published a series of articles arguing that the market had just begun a massive rally.  I even published an article titled "A Survival Guide for Bears in a Bulls World" (I still think it's one of my better pieces; might be worth a reread).  In February 2013, I published my preferred long-term targets for SPX; my first target was SPX 1750, and my second target was SPX 2170 (chart below).


All of this is intended to present an important point:  In 2013, I lost a lot of bearish readers because of my bullish stance.  Some bears got mad about it, and went to look for other analysts who would back up their biases, of which there are never any shortage.  Not sure how all that worked out for them, but I do know how things worked out for the market. 

So, with that said, here are the implications of the recent price action:

For the past few months, I've talked about the rally off the February low as the probable C-wave of a larger B-wave.  A few times I addressed the fact that B-waves are allowed to break key prior levels (such as the all-time high).  The issue for bears right now is that a B-wave that breaks a prior high is ultimately going to come back to that high, no matter what happens next.  In other words, even if SPX were to drop 500 points next week, it would most likely recover shortly thereafter, and return to break current prices.

That's an important understanding, because it means that whatever happens in the foreseeable future -- even if we got a huge drop from here -- will most likely still be occurring within the context of a larger ongoing bull market.

So... that's what bears are up against here.  At present, their best hope appears to be for a big C-wave decline that amounts to a temporary victory for sellers.

At worst (for bears), they are up against a rally that is going to keep grinding higher, with only temporary reprieves, for quite a while.

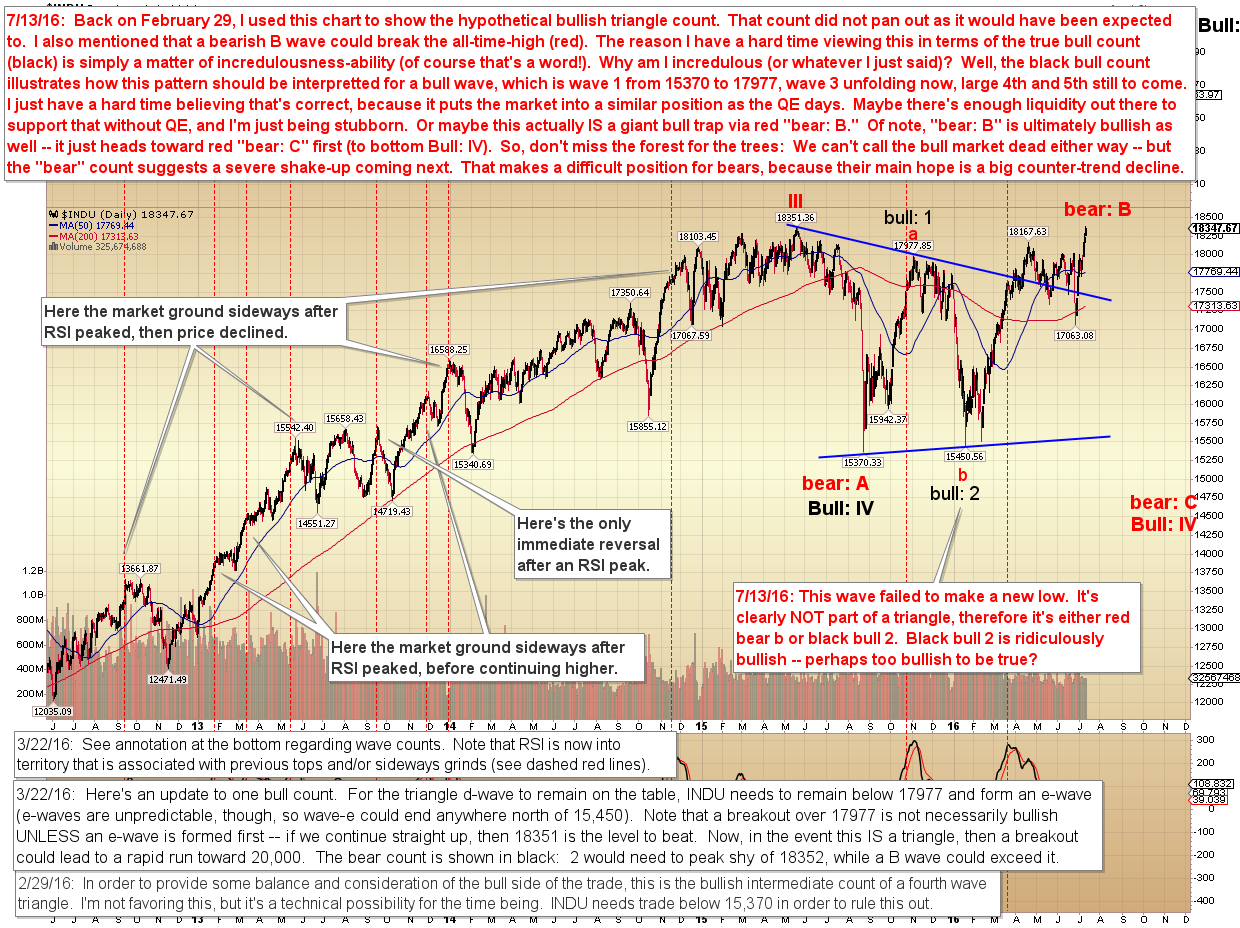
The chart below outlines the situation (as it appears at this exact moment) in a lot of detail.  I used INDU because it did NOT make a new low at red b/bull:2, so the implications of its pattern are clearer -- and for that same reason (see chart) this is the market that has thus kept me somewhat skeptical for a while now.


In conclusion, this is a very difficult position for bears to be in.  If this rally is a bearish B-wave, then it may be nearing completion -- but as I mentioned at the beginning of the month, this is a very difficult type of wave to front run.  The best thing we can do from here is watch for clear signals of a turn, then take it one trade at a time from there.  Be aware that if the "incredulous" count shown above is underway (despite my skepticism), then bearish trades will only work on short time frames, and things will remain bullish for longer than probably seems reasonable.  In the event the bearish B-wave count is correct, then the C-wave will be significant enough that it should allow time for bears to get on board.   Trade safe.