Amazon

Wednesday, October 27, 2021

SPX and the Index Formerly Known as INDU

I was going to say that there hasn't been much change since last update, but then I checked my StockCharts chartbook and was shocked to learn that INDU apparently ceased to exist yesterday.  This changes everything:


The long-term monthly chart for INDU looks equally grim:


So I'm not sure what to make of that.  I can only presume this means a planet-killing asteroid struck the Earth and I'm stuck in some sort of weird limbo where I still have to do updates for all eternity, possibly as punishment for that time in seventh grade when I forgot to return some library books.

Oddly, SPX seems to have made it into Limbo with me:


And continues to look bullish as long as the breakout sticks (maybe this is part of my punishment?):


In conclusion, INDU no longer exists, so I wouldn't worry too much about that particular index.  Again, barring some type of complex correction showing up out of nowhere, SPX continues to look like bears will be stuck in limbo with me for a while.  Trade safe.

Monday, October 25, 2021

SPX Update

No real change from last update, except to note that it's possible SPX completed blue iii of 3 at the most recent all-time high (which would still mean it's inside of the larger blue 3):


Bigger picture, if the current breakout sticks, then the upper blue line may come into play:


On another note, my friend Lee Adler posted an amusing piece on Friday... some quotes:


"US stock prices are rising again today, thanks to strong fundamental economic growth driven by free market capitalism. The rising tide of unfettered economic growth with no central bank interference means that stock prices should rise every day. And they do. What a world! All members of society will be rich, as the free market distributes wealth to all segments of society equally. Today is no exception. As you can see from this 2 hour bar chart, the market is now lifting off from a massive base. That base followed the terrible, and completely unnecessary September Bear Market of Blessed Memory. According to the rules of Modern Technical Analysis (aka MTA- change at 63rd Street for the Q line), all patterns are bullish, and the Measured Move Target (MMT, as derived) of 4680… Or 4860, I forget. Besides WTF difference does it make."

 "Modern Technical Analysis -- all patterns are bullish" cracked me up.  Apparently this market is frustrating more than one analyst right now.

In any case, in conclusion, no real change from Friday's update, with the addition of some more potential upside zones... in line with Modern Technical Analysis.  Trade safe.

Sunday, October 24, 2021

Is There a Climate "Crisis"? Part II: A Look at the Hard Evidence; Extreme Weather

[In Part I of this series, we examined the scientific literature and learned that the Arctic today is 2-4 C colder than it was a mere 6-12,000 years ago.]

To reiterate briefly from Part I:

"change" "crisis"

These are two very different words, with very different meanings.

"Change" means "to make or become different." 
"Crisis" means "a time of intense difficulty, trouble, or danger."

A few years back, all we heard was how there was a "consensus" on climate "change." But then politicians and the media gradually began to conflate the term "change" with the term "crisis," often by adding in their own commentary to "97% of scientists agree..." They would say things like, "97% of scientists agree the Earth is warming up and that if we don't do something immediate and drastic, then we're all going to perish in flames! Everyone RUN FOR YOUR LIVES!"

97% of scientists agreed to no such thing; but this verbal bait-and-switch has been done by politicians and media to the point that few seem to question it anymore.

Thus, [if one actually cares about what science has to say, anyway] it is extremely important to clarify that there is no consensus on a climate "crisis." There is a consensus on climate "change" (though one can strongly debate the methodology of the surveys used to determine that "consensus," and further debate whether consensus has any value in science in the first place -- but for sake of argument, let's grant that point for now anyway, because it's irrelevant), but it bears repeating that there is no consensus that this climate "change" represents any sort of "existential crisis" for the planet.


The idea that there's a "crisis" is held by a small minority of scientists, but, as this piece will show, that view is not shared by mainstream science.  

Please read that again if needed.  I'm not going to be citing "deniers" or fringe papers, I'm going to be citing mainstream organizations that are held to be the gold standard by even the most dyed-in-the-wool climate change believers.

If one accepts mainstream consensus science (which I am not necessarily condoning, mind you -- "consensus" is the business of politics, not science -- but that's a whole 'nother discussion), one will quickly see that climate "crisis" is a fringe position -- meaning: If one invokes consensus (thus implying that they accept mainstream science), then one must logically reject the idea that there's a crisis.

However, because the general public listens to the media more than they read scientific literature, many have accepted this fringe claim without question. So let's examine the claim, again using only mainstream science:

Claim:  Extreme weather events (such as hurricanes, tornadoes, floods, droughts, etc.) have increased; this is due to man-made climate change, which is caused by CO2 emissions

Made by:  Politicians, media, activists

Rejected by:  The Intergovernmental Panel on Climate Change (IPCC), The National Oceanic and Atmospheric Association (NOAA), The Environmental Protection Agency (EPA), most other mainstream scientists, and The Actual Hard Data

As we'll see in a moment, there is effectively zero basis for this claim.  This lie has been repeated so often that it "seems credible" to the point that it's become akin to an urban myth that "everyone knows" -- but we'll quickly see that mainstream science rejects this superstition.

The IPCC has done not one, but two "Special Report[s] on Extreme Weather," (in 2012 and 2018) to examine precisely this exact issue, so we'll start there.  

Before we get into that, though, it bears mention that many consider the IPCC to be too heavily biased toward blaming man/CO2 for climate change.  They have repeatedly pushed out scientists who dissent from the view that CO2 is a primary driver of climate.  Further, the IPCC's mandate is to find manmade climate change and to ignore natural explanations -- which leads to "when all you have is a hammer, everything looks like a nail" syndrome.  I consider them to be an alarmist organization, so when the IPCC says, "Nope, we're not seeing it," even given their heavy biases and incentive to find it... well, things don't get much stronger than that.

The full Reports (everything in blue is a live link -- some people in the comments seem to be missing this) are long reads (hundreds of pages each), which is why almost no one seems to know what's in them, so let's summarize via some screenshots of the summary highlights.

1. Floods

Here's what the IPCC says about global flood trends:  No sign that floods are increasing:


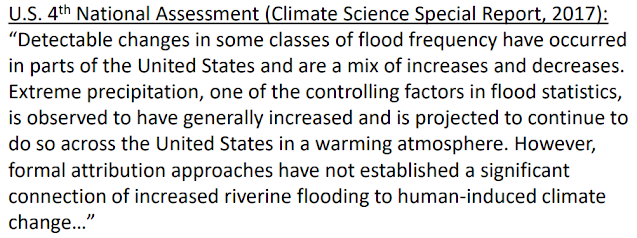
The U.S. National Climate Assessment (which examined only the USA) says there's a mixture of local increases and decreases, concluding that "approaches have not established a significant connection of increased riverine flooding to human-induced climate change":


2.  Drought

Here again, the IPCC sees no trend of increase in global droughts.  They even call out their own prior warnings as being "overstated."


This agrees with other mainstream scientific literature.  As one example:  Recently, we've been hearing a lot about California's drought -- few people realize that, to cite the paper below: 

"[S]ignificant drought conditions that were common prior to 1900 have not been experienced by the present population."

In other words, California isn't undergoing modern "climate change" as a result of your SUV -- it's merely reverting to its natural historic trends.


And both of these likewise agree with a study by Nature from a few years back.  Droughts appear to be decreasing, not increasing.


On this topic, let's take a brief moment to appreciate yet another failed negative climate prediction -- this one is from 33 years ago, and still going strong and dead wrong.  (If you saw this headline tomorrow, would it worry you?  You may be starting to realize why it shouldn't.)


3.  Hurricanes/cyclones

Here's what the IPCC says about hurricanes:  There has been a slight decrease in hurricane landfall numbers over the past century:


The IPCC's conclusion agrees with NOAA, who recently completed the largest hurricane study to date.  NOAA also finds no trend of increase -- to the contrary, they also find a slight negative trend since 1900:


The political nature of climate "science" is one the the reasons I take screenshots, such as the one above.  That study (as shown) was just done a year or so back, but they've already revised it (revised August 9 2021), and I'm not sure where the original is.  The new one still concludes:

Therefore, we conclude that it is premature to conclude with high confidence that increasing atmospheric greenhouse gas concentrations from human activities have had a detectable impact on Atlantic basin hurricane activity

So the conclusion is still the same -- no impact on hurricanes -- because the hard data is what it is, and the numbers simply aren't there (i.e.- there's been no actual increase in storms).  Nothing can make those missing storms appear, so what they do in the new report is couch those non-frightening bottom line conclusions with additional scary-sounding language warning about how awful it might get if the CO2 hypothesis ever starts working, since apparently 100+ years of data while CO2 rose steadily hasn't already proven the point that if hurricanes haven't increased yet, they're not likely to.  At least, not due to CO2, anyway.

According to World Bank, Big Climate is an $89 trillion (with a T) business, so there are plenty of vested interests with major monetary incentive to keep the public in a state of fear.  Hard to compete against that with simple hard data and mainstream science that no one reads.


Anyway, both of these newer reports continue to agree with the IPCC's findings from 2012:


These hurricane studies are pretty conclusive, with very little ambivalence.  If you've been getting your "science" from politicians and media, then I imagine it comes as a shock to learn the that mainstream scientific community does not support what you have been led to believe -- so your first reaction may be to look for ways to reject this "new" information and thus preserve those old beliefs ("cognitive dissonance").  I recommend giving this "new" data a little time to sink in.  

(And then reasoning out the inexorable conclusion:  It is a mistake to trust politicians and media simply because they invoke the mantle of "science."  Snake-oil salesmen of the 1800s likewise claimed that their false cures "followed the science."  It's one of the oldest con games in the book.  The media's take on climate change is more superstition than science, and politicians use the resulting public ignorance to their advantage, as we'll see in a moment.)


4.  Tornadoes

Strong tornadoes, likewise, are decreasing, not increasing:


To summarize:  The actual, mainstream science on all this is abundantly clear:  There is no link between "climate change" and extreme weather.  None whatsoever.  Next time someone in "authority" tries to tell you there is, you will be inoculated against the manipulations of such climate charlatans.

"When you get two record rainfalls in a week, that's not coincidence." "Global warming is upon us, and it's going to get worse and worse and worse unless we do something about it." "Woe is us if we don't recognize these changes are due to climate change." -- Senator Chuck Schumer

“The past few days of Hurricane Ida and the wildfires in the west and the unprecedented flash floods in New York and New Jersey is yet another reminder that these extreme storms and the climate crisis are here."  "This isn't about politics." -- President Joe Biden

As the data plainly reveals:  Politics seems to be exactly what this is about.  Get people scared, then use their fear to generate public support for policies the public would not otherwise support if they were not being placed under duress.

Sadly, this unfettered manipulation by our politicians is not harmless.  It comes with real human cost:


Wouldn't it be better to tell our kids the truth: That there is no climate "crisis"?  Have we become so desperate in our pursuit of power that we've lost our humanity?

Oh, and those earlier quotes reminded me... let's talk about wildfires, too, since that's another anti-science stance the alarmists have taken, and it keeps getting repeated to the point that many people think it's true.  It is not.  

5.  Wildfires

This first graph comes from the USDA (and is the most recent I can find from that particular agency).  It shows that wildfires declined substantially while CO2 rose:


The continuation of that data (from the National Interagency Fire Center) is similar.  Wildfires have decreased, not increased:


Data on Amazon wildfires comes from the LA Times.  Correlation is not causation, but when there's not even a correlation, you have no case whatsoever.


Linking wildfires to climate change is, again, anti-science superstitious nonsense with no data to support it.

So you can follow the science, or you can follow the politicians/media.  But you cannot follow both, because they contradict each other.

Last point, because this is more anti-science propaganda I hear repeated ad infinitum:  

6.  Heat waves

Surely heat waves have been getting worse!  After all, the theory is that CO2 causes the atmosphere to retain more heat (again, this is the actual theory underpinning "climate change"), so heat waves must be getting worse.  Right?  Remember this summer?  RIGHT?

Well, not according to the EPA.  While heat waves will always be a part of life on planet Earth, in recent decades, heat waves have decreased significantly.  Despite the fact that CO2 has been rising steadily. 


Now, the funny thing about the chart above is that it's no longer on the EPA website (that I can find, anyway; glad I screenshotted it a few months ago) -- they recently changed their new graphs so that they begin in 1960!  Look at the full chart, and see if you can figure out why they'd make that change.  Below is what happens when you leave off the "inconvenient data":  You create a false impression that heat waves are increasing over time. 

Are they removing long-term data to serve "science"?  Or politics?


Misleading graphs aside, to reiterate one last time:  There is no correlation between "climate change" and extreme weather.  And there isn't a single shred of evidence to even modestly support such claims.  

All the alarmists have is the same thing they had back in 1988:  Unsubstantiated speculation that "bUt wEatheR is gOinG to gEt wOrSe!!!111!!!"  Speculation isn't science, and climate speculation has been dead wrong for 50 years running, while the hard evidence is clear.  The data continues to refute the speculation.

The bottom line is that the IPCC, NOAA, et al, have concluded that there's been no increase in extreme weather at all, so there's zero basis for claiming an increase, and that much less of a
basis for claiming that this nonexistent increase is "due to man-made climate change"!  

Thus, the entire push to blame extreme weather on "climate change" is complete nonsense.

Mankind has always believed it can control the weather via dancing, human sacrifice, or by other means.  I assume this is why this superstition was easy to revive:  It's hard-wired into us to think weather is some kind of "punishment for our sins."  In this case, our sin is merely finding ways to survive a harsh planet in some degree of safety.  We clearly do not believe we deserve even that small grace, so now we're trying to undo it.

Which brings us to the final point:  Climate-related deaths have plummeted over the past 100 years:


(above graph from Dr. Bjorn Lomborg)

This massive reduction in climate death is due to the safety that cheap and reliable energy provides for people.  Taking that away in favor of unreliable sources such as wind and solar won't "save" people, it will harm them.  (Just as wind and solar absolutely devastate the natural environment, which I may cover in a future piece).  Isn't the goal to "save" the planet?  What does that even mean if it excludes saving your fellow humans?

Join me in saving the planet: Reject climate superstition and propaganda, and follow the science instead.  The choice is now yours.

Friday, October 22, 2021

SPX and COMPQ: Back to the Drawing Board

Been a while since I had to eat crow, so I had forgotten how bitter it tastes, and for the first time in a long time, I feel that old bearish urge to complain about the disconnect between the market and the real economy, about Fed funny money, and about, well, just general late-stage-republic nonsense. 

But I'm always preaching about how the market is what it is, so I'll attempt to refrain from all that and simply say that the bear count I was leaning into has officially been kicked out with the new all-time high, so the preferred count was a bust this time around.

It turns out that those long-term trend lines, which we talked about a few times, were apparently all the market was aiming for.


COMPQ:


Same thing with the chart we previously looked at for TRAN.  Obviously, were the market to return back to that line anytime soon and sustain a breakdown, then maybe bears would be back in business.

Near-term, there's some temptation to try to count this as a triangle, due to the overlapping mess in the middle, but it would need to be a running triangle if it were to be a triangle at all, and running triangle is one of the patterns I try to avoid using unless absolutely necessary.


In conclusion, bulls have killed the bear 1-2 count, but bears do still have the option for a more complex flat.  If this is the most bullish count (blue), then bears will have to wait on the back burner for at least a little while.  Bigger picture, presuming this breakout sticks, we are again going to be back to wondering if the market gets its extended fifth wave after all.  Trade safe.

Wednesday, October 20, 2021

SPX and TRAN: Real Estate Running Thin

Since last update, the market has continued its rally relentlessly, which means the ending diagonal possibility is off the table.  While not all the bear options are off the table yet, bears are beginning to run low on real estate.


Bigger picture, the long-term trend lines we looked at a while back have all continued to hold.


In conclusion, bears have been absent since the Fed minutes were released, leading to a relentless rally that could very well be a developing impulse wave, if bears don't show up again soon.  It seems the disconnect between the stock market and the real-world has already reached all-time highs, but we'll see if the all-time-high price point in SPX is able to stall this, or not, before determining if we have to eat crow.  Trade safe.

Monday, October 18, 2021

SPX Update: ...with the addition of a surprise...

Not much to add to Friday's update, except to note that the market reached the minimum price zone for a C-wave, which means it does now have a couple additional options here... neither of those additional options are terribly predictable, though, so we have to file them under "Just Things to Be Aware Of" right now:


In conclusion, the only noteworthy thing to add since Friday's update is the mention that SPX did break the old presumed A-wave high (the minimum upside price target for a C-wave), which does at least open the possibilities of a surprise from the market here, as noted on the chart annotation.  Trade safe.

Friday, October 15, 2021

SPX Update: Three Wave Pshaw

Since last update, SPX declined down to the blue iii label on the near-term chart (second chart today), then bounced strongly after the Fed minutes were released.  From there, it managed to claw its way back above 4429, which kicks out the immediately bearish idea of "bear: ii," but leaves open the possibility of the current wave developing as an ending diagonal (first mentioned on 10/8).  Please note the sketch below is not intended to be an exact roadmap, more of a very general "artist's rendition of an ending diagonal, still at large."


Near-term, SPX captured blue iii from the charts -- and while that wasn't all bears and I were hoping for, the end of wave three can always be the end of wave C (when no fourth and fifth waves materialize):


The clear three-wave nature of the rally from 4278 to 4429 had me pretty sold on the idea of a subdividing third wave, but that option has been kicked in the head now.  

Back at the end of September, I began discussing the idea of the price low (which wasn't even in yet -- 4278 eventually becoming that low) marking the bottom of a B-wave and a C-wave developing from there, to run back up to north of 4465... I initially liked that idea because of the pattern in ES futures, which (back at the first high of 4465) had made a new high relative to cash.  But then, after the very obvious three wave rally to 4429, I started to second guess that (which is easy to do when you're dealing with a subtle initial clue, such as something that only shows up in the futures market).  Now it appears that initial read was more correct than the latter read.

And to examine the complete other side of the trade:  On the bull side of the coin, we have to refer back to the number of charts I showed that had all back-tested long-term trend lines from above.  SPX, COMPQ, and TRAN were among the charts that showed this back test, and on October 8 I wrote: 

Last update noted the bevy of long-term trendlines just below the market, and, not surprisingly, the market managed a respectable bounce from those lines. If you're a bull, then that's the back-test you were hoping for, and you probably stay the course.

Obviously, "stay the course" is not the direction I've been leaning, but this is why I try not to ignore things that run contrary to my own biases.  Especially when, as I wrote a few times, it's very early in the pattern and thus there's nothing resembling "confirmation" yet.  So, along those same lines, the bull version of the three-wave rally is not an ending diagonal, but a bull nest.


In conclusion, the three wave rally off the October lows was not a subdividing bear ii.  That idea was wrong and is off the table.  From here, the bear version of the pattern is an ending diagonal C-wave, while the bull version is a bull nest.  We'll track these as they develop.  Trade safe.