Amazon

Friday, December 17, 2021

SPX Update

Since last update, the Fed announced they would double the taper to $30 billion per month, and the market rallied on this "news."  They've also agreed to stop calling inflation "transitory."  Took them long enough.  As I wrote back on May 10:  


In other news, inflation is picking up a pretty solid head of steam, which will be interesting, inasmuch as the Fed really hasn't had to deal with any inflation since the beginning of Quantitative Easing in 2009. It's obviously easier to print money in a deflation, since liquidity is being destroyed faster than it's being created, leaving you lots of wiggle room. When inflation begins to take hold, then printing money no longer leads to "pretend wealth," it leads directly to wealth destruction, as you dilute the value of each dollar that's already in circulation. When inflation is underway, printing money becomes a silent tax on the working class, because you are essentially stealing the value of their wages and savings and putting that value into your freshly-minted currency. Of course, years of deflation have led naïve politicians to believe there are no consequences to money printing, so, as so often happens, the current generation is ill-prepared for what seems to be developing.

Young people often believe that "old-fashioned" wisdom is outdated, when it should instead be viewed as the collective lessons that humanity has learned through thousands of years of trial and error.  

 “Tradition is a set of solutions for which we have forgotten the problems. Throw away the solution and you get the problem back. Sometimes the problem has mutated or disappeared. Often it is still there as strong as it ever was.” ― Donald Kingsbury


Despite what proponents of MMT seem to think, a government can only print so much money before inflation rears its ugly head, and all the money printing turns out to be zero-sum, punishing savers and wage earners in the process.
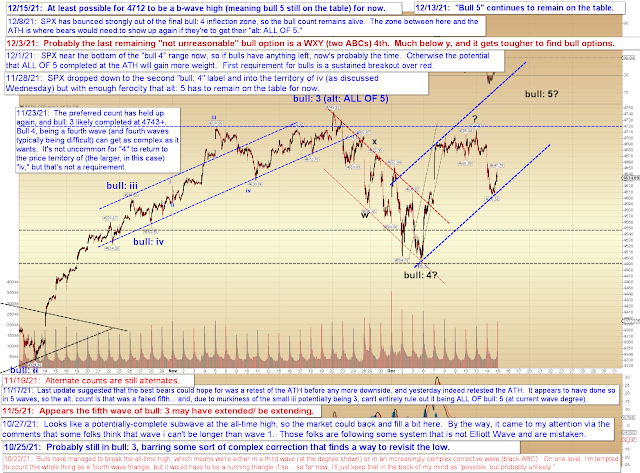
Back to the market.  Last update warned:

[T]here is at least a chance that the "?" high is a b-wave, which would mean we're headed back up there.

That proved out -- and the most recent rally leg did the minimum structure needed for a fifth wave, so now we have a few possibilities:


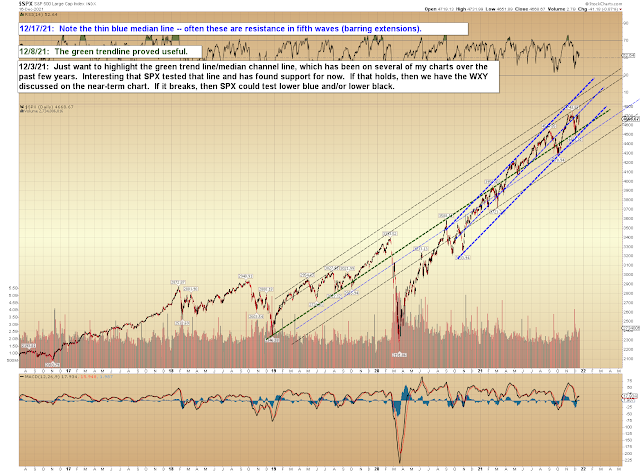
Intermediate-term, interesting how SPX stalled at the median channel line.  If this is a complex iv of 5, then it will tag it again... if that was a failed fifth, then it's done what it needed to:


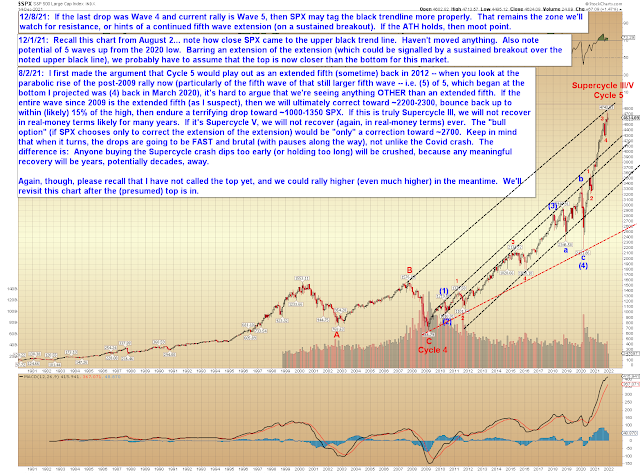
No change to the big picture:


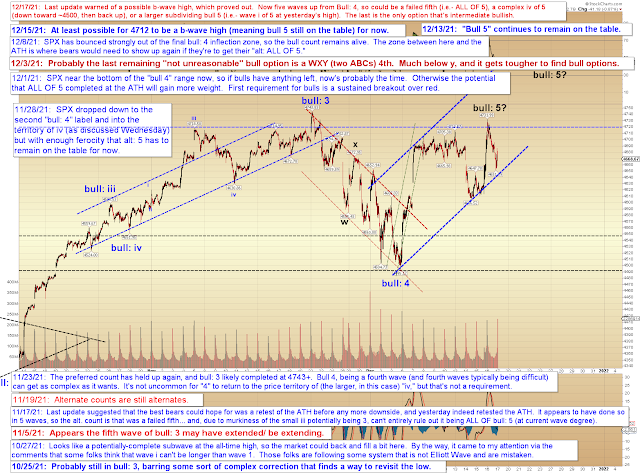
In conclusion, while I've been leaning toward a fifth of bull: 5, we now have enough structure in place that we have to more seriously consider the possibility that it completed as a failed fifth.  We'll see how the market reacts to the zone near and/or a bit south of 4600 (assuming we get there), and if it can't find support, then we'll take it from there.  Trade safe.

Wednesday, December 15, 2021

SPX Update

Since last update, SPX found resistance in the potential resistance zone noted on December 8, and denoted on the chart by the highly technical Elliott Wave symbol:  "?".  This, of course, keeps both possibilities on the table, but there is at least a chance that the "?" high is a b-wave, which would mean we're headed back up there.  I'm far from certain of that, though, so we'll see if bulls can hold the general zone near this week's low:


No change bigger picture, so, near-term question marks aside, I continue to suspect that this is most likely still "top is closer than the bottom" territory.


In conclusion, the near-term jury is still out on the status of the current rally as a fifth wave to new highs (or whether said wave has already completed), but no change to the bigger picture. Trade safe.

Monday, December 13, 2021

SPX Update: No Material Change

Still not too much to add to the past couple weeks of updates; the market has been trading sideways/up since December 7.  Obviously, the Bull: 5 count remains active:


Bigger picture, if bulls do get their low-degree fifth wave here, then (barring a fifth wave extension) that will have potential to complete the rally at one or more wave degrees, up to and including the entire bull wave since 2009.  


In conclusion, no material change from the past few updates.  Trade safe.

Friday, December 10, 2021

SPX Update

Nothing much to add since last update, but I did stumble across this chart of inflation-adjusted earnings yield from Bloomberg and found it interesting as a possible fundamental argument favoring the idea that Wave 5 could be near completion/complete:


Chart-wise, we're still in pretty much the same spot we were in last update:


No change to my stance on the long-term unless SPX can sustain a breakout over the noted trend line:


In conclusion, no change to the last few updates, but the earnings yield chart is interesting.  Traditionally (for whatever that's worth these days), low earnings yield suggests overvaluation, and present readings are extreme.  Trade safe.

Wednesday, December 8, 2021

SPX Update

Last update noted that the intermediate green trend line had held, and anticipated a sizeable bounce either way, but SPX has now exceeded the sketched bounce and is thus keeping the "Bull: 4" option alive.  

Let's start with the intermediate chart; the green trend line can continue to be used as a potential warning zone for bulls:


Next up is the near term.  If bears are still in the building, then they'll need to show up soon:


Bigger picture, if the bull: 4 count continues to hold and the all-time high breaks, then we'll watch the upper channel line next:


In conclusion, this is not an easy market by any means.  After acting crazy for a while, SPX has bounced strongly, keeping the "bull: 4" count on the table, but bulls are now into a zone where they may face resistance from the all-time high, so we'll see if they can keep that momentum going, or if the market stalls out soon, near-term or otherwise.  Trade safe.

Monday, December 6, 2021

SPX Update


Last update discussed the intermediate green line, and SPX again found support in that zone on Friday:


Near-term, still no overlap of the first waves, so still can't rule out the fourth wave option.  In gray is just one near-term potential if the fourth wave doesn't show up... but this is a difficult overlapping mess of a wave (in the downward direction) since the ATH, so take it with a grain of salt:


In conclusion, not much else to add to the past week's-worth of updates.  Trade safe.

Friday, December 3, 2021

SPX Update: Green Line in the Sand

The last couple updates have been quite detailed, so there's no need to rehash all that, so we can instead get back to the near-term now.  First up, the short-term SPX chart shows that this week's low could be a complete WXY correction, and that's probably the last "not unusual" type of wave that could fit as a fourth wave (in other words, it's not impossible for an even more complex correction, but that would be an outlier type of wave).


Bigger picture, the green trend line highlighted below has been on a number of my charts through the years, so it's interesting that SPX has found at least some support there:


In conclusion, the fourth wave option for bulls isn't dead yet, but if SPX heads much lower, then there won't be many common waves that could still fit for a near-term bull count.  New lows would also break the green trend line, so that's probably the first line in the sand for bulls now... and the most bearish potential count out there is a nasty bear nest... so in the event of any sustained new lows, bulls should probably exercise extreme caution.  Trade safe.