Amazon

Friday, February 4, 2022

SPX Update

Last update called out the next potential resistance, and SPX stalled almost too cleanly at the first tag of that zone (also, note:  "overlap at 4418 WOULD suggest the rally was a three wave structure, etc."):


Potential "support" zones are highlighted on that chart now, but if the market has turned into a bear already (i.e.- if no final fifth is coming), then market participants may find that support "ain't what it used to be."

Longer-term, bears still want to see a whipsaw back into the channel to help confirm their intentions to take over the market:


Beyond that, not much to add to the past few updates.  Trade safe.

Wednesday, February 2, 2022

SPX, NYA, COMPQ: 2-2 Twain

As those of you who own calendars are no doubt aware, today is 2/2/22, which is the only time in our lifetimes that the only digit needed to write the date will be "2" (except for 2/22/22, which is farther away than it seems) and there won't be any other dates like those until the next one (I'm too lazy to look up or calculate when that will be; I've got an update to complete!  Probably 3/3/33.).  2/2/22 is also a palindrome, for people whose favorite month is "22."  And it's the closest we'll come to riding the "too-too twain" (with a nod to the movie Murder by Death).

Anyway, there are a lot of charts to cover today, so we need to quit messing around here.

First up, the current bounce began in an area that made sense, and which we discussed repeatedly as "the zone bears need to beat" last week:


A similar look in COMPQ:


Near-term, SPX has a couple of trend lines that could act as next resistance:


On COMPQ, the zones are horizontal:


And finally, NYA continues to show the bull option:


In conclusion, SPX captured and exceed the 4525 target given in the last update, which is no surprise given the long-term support lines, and is now approaching its next potential resistance zones.  The big question is whether this is a fifth wave to wrap up the lingering question of whether the all-time high was a b-wave, or a true "bear market bounce" (i.e.- second/fourth wave).  COMPQ is one of the clearer markets to watch for a possible early answer to that question.  Trade safe.

Monday, January 31, 2022

INDU, COMPQ, SPX, and a Whole Bunch of Interesting Data

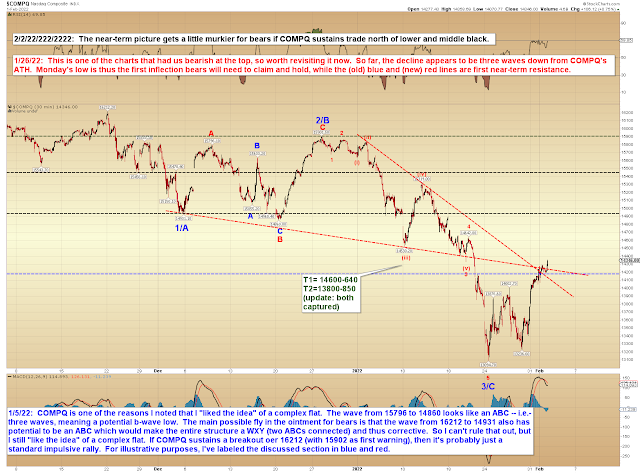
The near term charts remain messy, so we're going to continue focusing on the longer-term chart pictures.

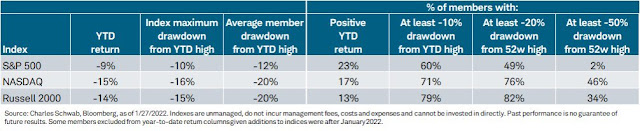
Before that, though, I'd like to share some interesting data I've gathered from various sources over the past week, starting with this (below).  Almost half of the members of SPX, and 76% of COMPQ, have already experienced drawdown equal to or greater than 20%.  Almost half of the NASDAQ has declined 50% (or more) from its 52 week highs:


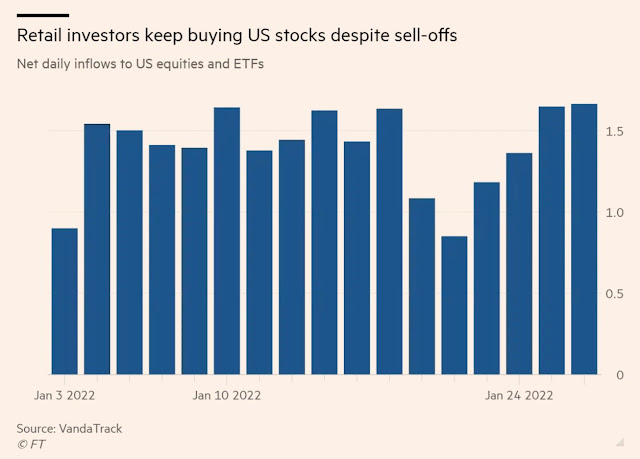
Next, retail investors have remained net buyers during the drop (this can be something of a contrarian indicator, since retail investors aren't considered "smart money"):


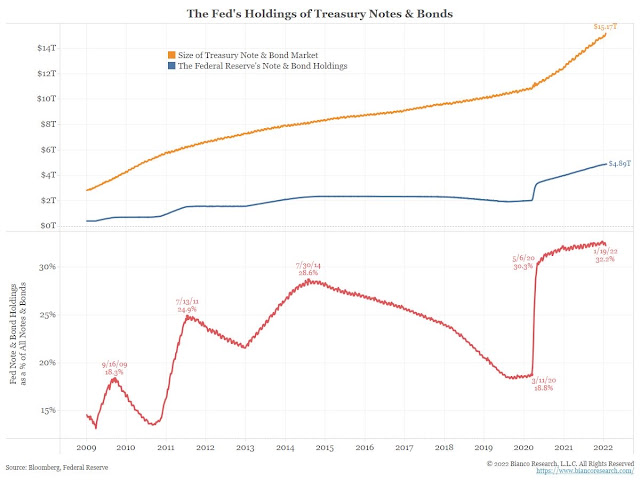
Next, a chart showing that the Federal Reserve's holdings of "Trashuries" is now almost a third of the total market:


Finally, company earnings guidance has turned negative for the first time since April 2020:


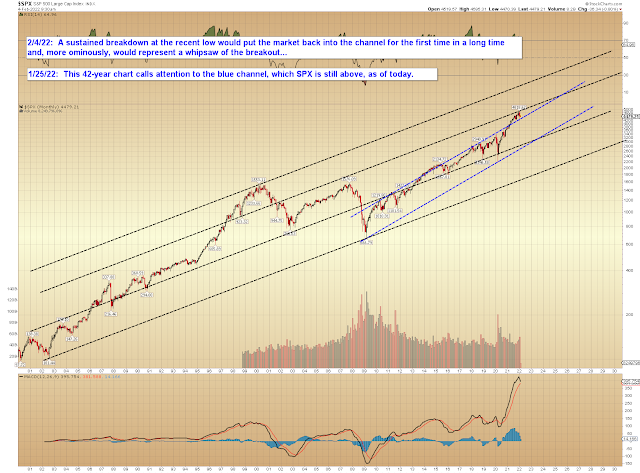
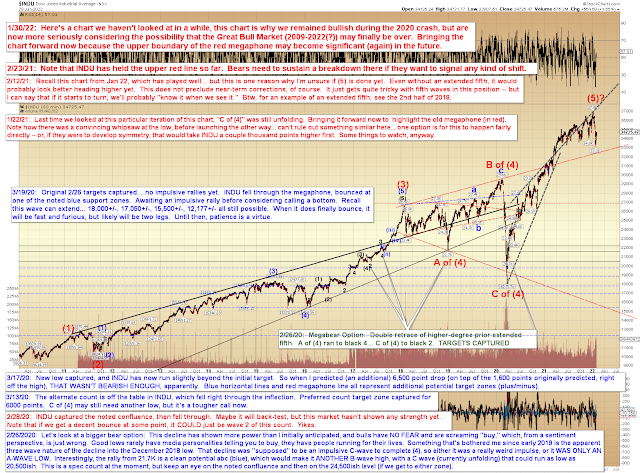
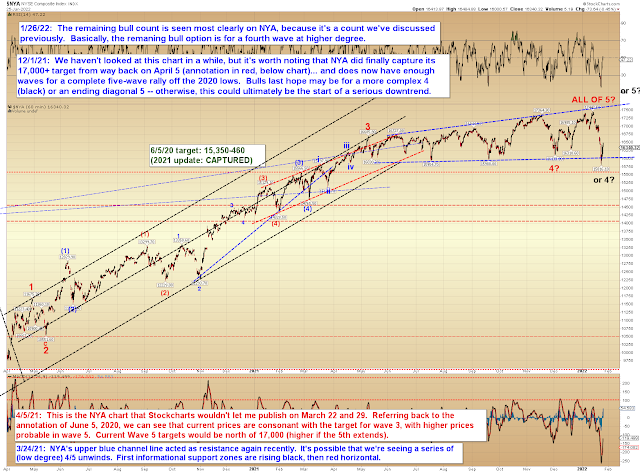
Let's move on to the long-term charts, starting with a "legacy" chart of INDU:


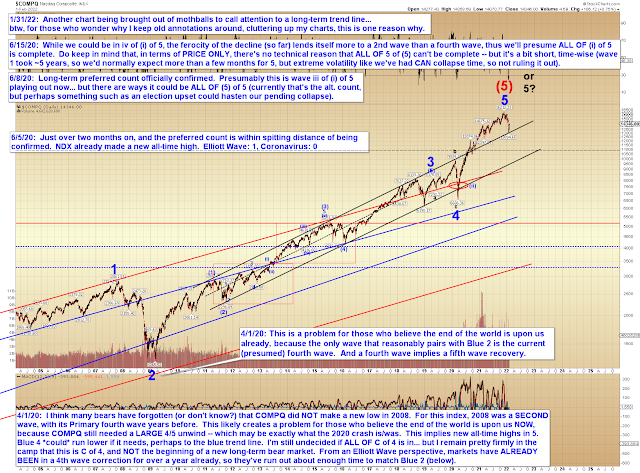
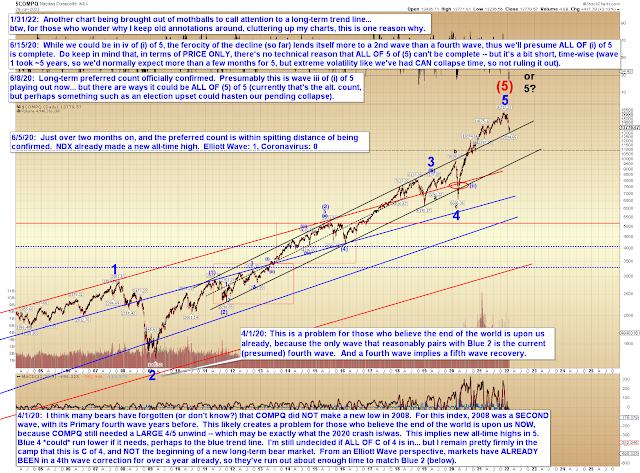
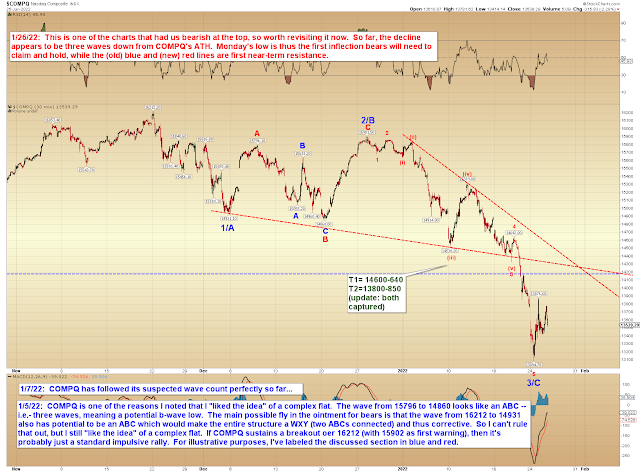
Below is another legacy chart, this one of COMPQ, which, unlike INDU, has already tagged its noted trend line:


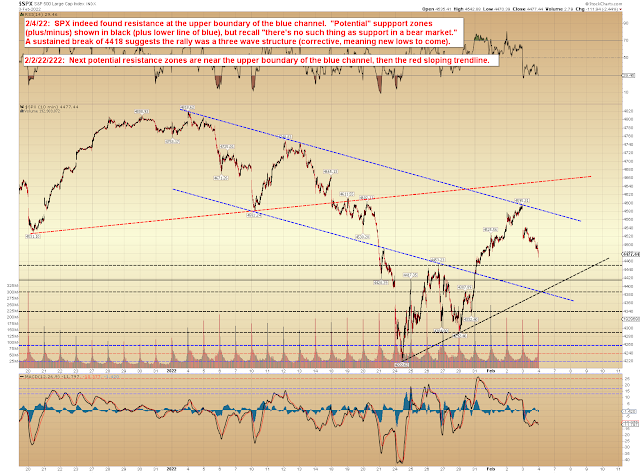
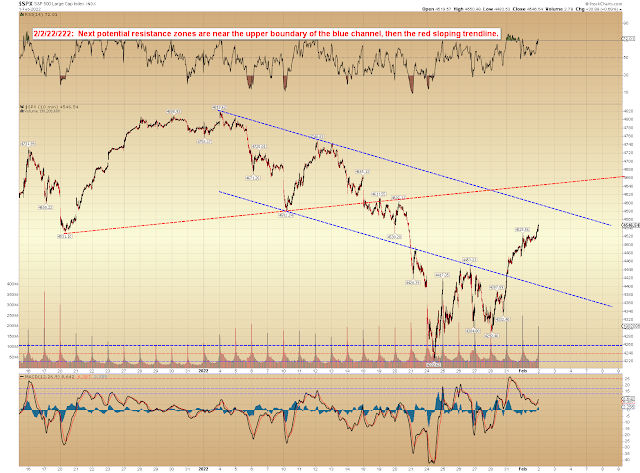
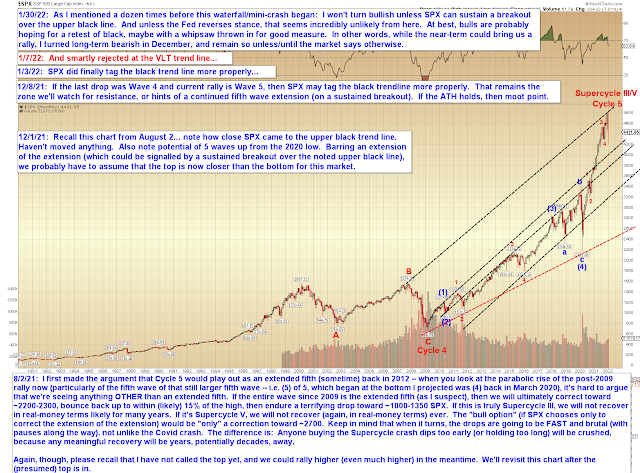
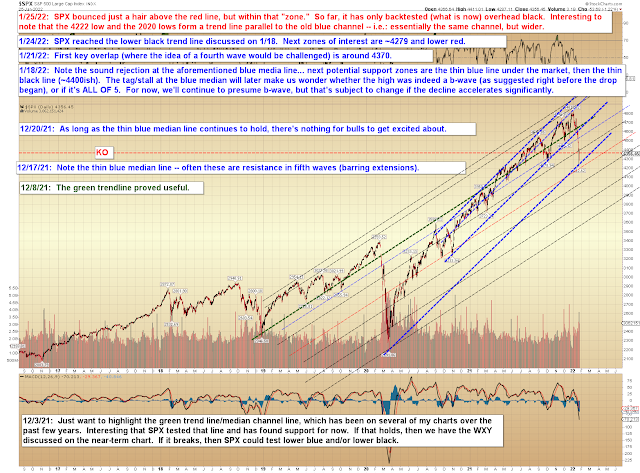
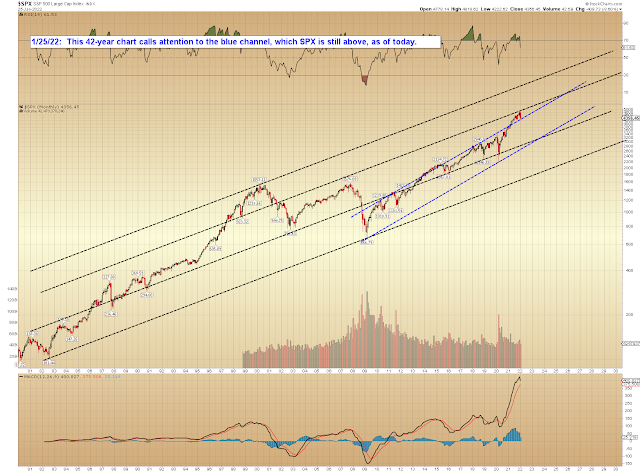
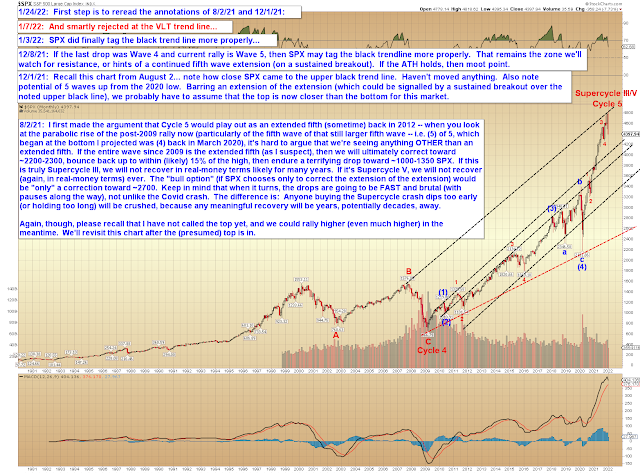
SPX very-long-term trend line (again) below.  Are you sensing a theme here...?


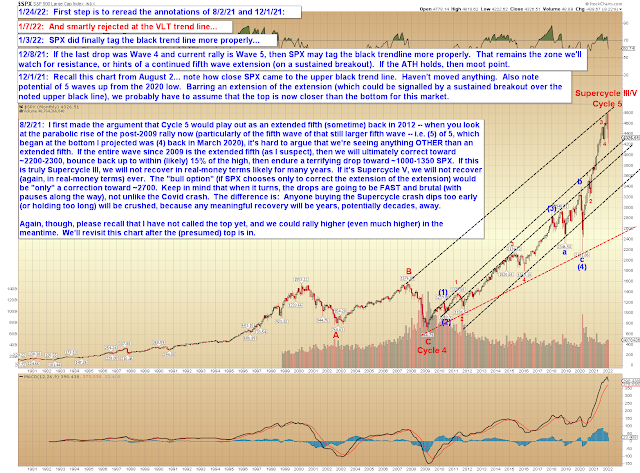
Finally, the SPX chart that proved incredibly accurate at foreseeing the recent top:


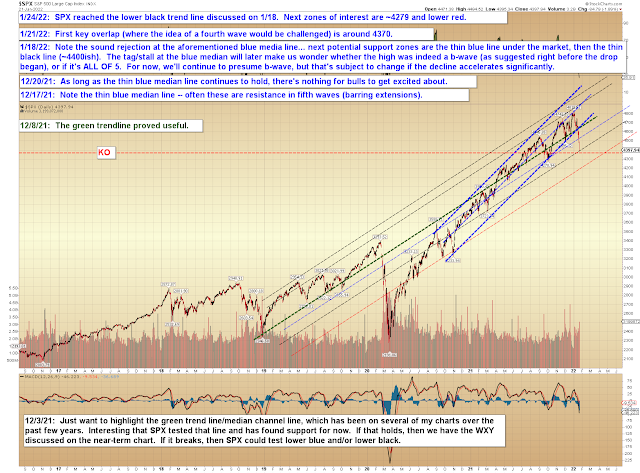
Near-term, one possibility is that SPX is forming a fourth wave triangle.  I posted the chart below to the forum during the session on Friday.  This count is speculative at the moment, not a "prediction" yet, and would be ruled out if SPX sustains trade over 4453 (which, if it happens, could take SPX toward 4525 or beyond):


In conclusion, as we've seen across markets, there is support at (and a bit below, in one case) the recent lows in the form of long-term trendlines.  As long as bulls can hold those, then they at least keep hope alive for a continued bounce, and even for a last trip to overhead resistance (though I wouldn't hold my breath waiting for that; easy to get caught looking in a market like this) -- but in either case, as I preached throughout December, I believe this remains a "sell the bounces" market.  Trade safe.

Friday, January 28, 2022

SPX Update: Other Than That

The market has remained stuck in a trading range since January 24, so there's little to add to the past few updates, except to note that I have examined some additional markets since then, and so I'll reiterate that I think any sustained new low will put the odds increasingly in bears' favor.  Meaning if that condition is met, it will become increasingly likely that the bull market we've been in since 2009 has truly ended.

Other than that, not much to add.  ("Other than that, Mrs. Lincoln, how was the play?")

Although I should mention that I noted in the forum during the session yesterday that, near-term, I suspect yesterday's low in SPX is a b-wave, meaning the market should break that low.


Note that SPX has, so far, been unable to sustain trade back above black (cue AC/DC):


In conclusion, while I spent most of December warning that it was "Time to Sell the Rallies," to reiterate: if SPX/ES sustain a break of this month's low, odds will increase that a true bear market has finally begun.  Here, I'd like to quote a bit from one December update:

Now, here's the "market point": The Covid crash was a pretty clear fourth wave. That means we have almost-certainly been riding out the fifth wave ever since. And the fifth wave is the final wave of a move -- which, now that we're finally getting into a potentially-complete wave structure, means we're likely approaching the end of the 12+ year bull market. 

What we're currently trying to nail down is whether the fifth wave of the fifth wave of that larger fifth wave has completed or not. 

Read that again. 

As I mentioned last update: 

Even if SPX manages to make a new high, that will probably be the fifth wave, and (barring an extension) is thus reasonably likely to be followed by a correction (or worse) anyway. 

In other words, even if SPX manages to make a new all-time high, we are probably into territory where we should be considering selling the bounces. Let's look at the near-term chart first, with the emphasis that "bull 5," even if it shows up, could very well be the final high of this 12+ year bull market.

Trade safe.

Wednesday, January 26, 2022

SPX, NYA, COMPQ: Big Fed Day

Today is the Big Fed Day, and the Fed is now staring down the market with one eye and inflation with the other.  "Which eye will they blink first?"  -- is the question.

So there's a lot to cover today via charts.  First, everyone wants to know if there's a remaining bull option, so it's important to clarify that while the fourth wave discussed previously in SPX is off the table, a higher degree complex fourth wave is not.  Let's start with looking at that -- and even short-term readers should remember this chart, because we looked at a version of this option as recently as last month.  The thing about complex fourth waves is that they are, well, as the name implies, "complex," and can keep tacking on runner waves, extending the fractal.


Next, let's look at the chart that had us turn bearish right at the high -- in essence, the chart that "started it all" and got us this far on the right side of the trade immediately before this little mini-crash began:


Next, an interesting observation about the recent low, which did come within the red target zone:


Finally, sometimes it's nice to step back and simplify:


In conclusion, the Fed has driven this rally for most of the past 13 years (with the brief exception of 2017-2019, give or take a little, when the Fed eased off the accelerator), so don't underestimate the significance of today's Fed statement.  If they don't at least hint at a course reversal or delay, the market will remain under significant pressure.  The problem is, the government cannot intervene in a market for a decade without serious unintended (and intended) consequences -- and the Fed has (as many of us have warned) painted the market into an unsustainable corner.  

We can see on the charts that the market has found support at an inflection zone while it waits on the Fed.  Today could be for all the marbles.  Trade safe.

Monday, January 24, 2022

SPX Update: How Soon is Now?

Futures are indicating that the fourth wave option might be off the table.

In December, I began warning that it may be "time to sell the rallies" and reiterated a number of times that it was my belief that "the top is closer than the bottom."  I cited the very long-term trend line on the chart below as my "line in the sand," and then referred back to this line repeatedly throughout last month.  

As one example, on December 20, I wrote:

I hold to my view that the top is closer than the bottom (long-term), unless there's a breakout at the very long-term trend line I've mentioned repeatedly over the past few weeks. That trend line will remain as the first litmus test where I might question my current thesis:

We then tagged that line a few weeks ago, failed to break out (and reversed), immediately began looking for a trip south of ~4495, and the rest has been history so far.


On Friday, we reached the next downside target zone, and futures are indicating this morning that line will break, so the market wants even lower:


In conclusion, I would emphasize that it's important to reread the annotations on the first chart from 12/1/21 and 8/2/21.  This market has been playing with fire for a while, and we've known that.  We also began looking for a top right at the all-time high, and while the initial lean was for a bottom "below ~4495" (ideally at the black line near 4400 above), if things are more bearish than that, then we haven't missed much.  We'll revisit everything on Wednesday and take a look at the near-term then, but nothing that's happening now should come as too much of a surprise.  Trade safe.

Friday, January 21, 2022

SPX Update: 4495 Target Captured: ~300 Points of Profit to Begin 2022

SPX captured its target zone yesterday, so we'll just pause here for a moment and let the charts do the talking:


Near-term:


Very long-term is currently an ugly bar on the monthly in snapshot, but the month isn't over yet:


In conclusion, SPX captured its January 3 target zone yesterday, so we'll pause here and let the market dictate whether it's going to find support soon or transmute into something more bearish.  Trade safe.