Amazon

Friday, April 1, 2022

SPX Update: April Fool's?

Last update noted that Red 5 could end at any time, and it ended right there.  Let's get right to the charts.  First up is the straightforward C-wave we've been discussing for a while, but after that, I'm going to show an alternate count:


I noted back on March 23 that this zone would be an inflection point for more complex options, so the next chart shows one option the market has if, instead of the C-wave, it wants to get really wild:


Big picture, no change since December:


In conclusion, the market has followed the preferred count right up into the anticipated inflection zone.  It does have options here, but for now, we'll presume it wants the simplest one.  That said, as the second chart shows, it's not a bad idea for traders to stay on their toes near this (or any) inflection zone.  Trade safe.

Wednesday, March 30, 2022

SPX Update: Red 5, Standing By

The rally in SPX has continued virtually unabated, so I'm glad we've maintained our bullish stance.  Yesterday, SPX also captured the 4595 target, first mentioned on February 25:


On the hourly chart, the pattern requires that we at least consider the possibility that red 4 was truncated.  The other option, which would be more bullish, would be that we haven't even seen red 4 yet.  For now, I'm going to favor the former option, but will remain open to the market's input, as always.


In conclusion, ideally, we'd see the larger blue 4 show up resonably soon, but do keep in mind that blue 3/c is something of an inflection point (in the event of more complex patterns than the simple blue C wave as shown above), so a larger correction isn't entirely outside the realm of possibility.  Trade safe.

Monday, March 28, 2022

SPX and Food Supply Update

Last update maintained the short-term bullish stance we've held for the past week-plus, but we still remain in the ballpark where red 3 of blue 3 of the presumed C-wave rally could peak, which will then send the market into a corrective fourth wave -- ideally afterwards, it will rally again to complete blue 3 of bull C, then correct again, then rally one last time to wrap up the corrective wave C of a larger expanded flat correction.


After that, presuming that read is correct, things will start to get ugly -- potentially very, very ugly.  Until then (or until we have reason to think the presumed wave C might be cut short, at least), I continue to believe bears would be wise to be patient.  The equities market needs a last hurrah.  If the rally does indeed continue, bears should view it as an opportunity, not a source of frustration. 

Just as bull markets are said to "climb a wall of worry," bear markets are described as "sliding down a slope of hope."  Especially in the early stages of a bear, the market does not believe itself to be in a bear market, and there have to be rallies along the way for investors to maintain hope.  In the final analysis, bear markets will provide numerous trading opportunities in both directions for the nimble and discerning trader -- waterfall declines followed by blistering rocket-launch short-covering rallies.  Bear markets never go "straight to zero," nor would we want them to, because it's hard to compound one's principle during a linear move. 

In related news, President Biden just told us to expect food shortages:


That would be a first for my lifetime.  And probably for yours, as well.  But it sure fits with the idea of a Supercycle bear market.

Further related:  The price of ammonia, which is the key foundation of fertilizer, is skyrocketing:


We won't even get into the global bond market (which vastly eclipses the size of the US equity market) today, which just suffered the fastest decline it's seen in decades -- but this is a big deal.  Bond traders tend to be "smart money."  And if the bond market gets "sick," equities cannot be far behind.

I keep hearing equities bulls say things such as "What's the issue?  Rates are still near record lows!"  As I mentioned on the forum, I believe this is the wrong framework.  The relevant question isn't "How do rates compare to historic averages?"  The relevant question is: "How much of current economic activity is predicated on continued low rates and Fed pumping?"  My suspicion is:  A great deal of it.

So the table is set here, fundamentally, in a way we haven't seen since 2007 or so.  And really, the potentials are far worse than 2007 in many ways (as we'd expect, if my belief that the "Great Recession" was actually a lower degree bear than the one we're about to enter is correct).  For example, if we were to start suffering food shortages in America, where does that lead?  Mass rioting might be a start.  Total chaos in major cities, if it continues.  Hungry people do crazy things.  Even otherwise good people will break laws if their families are starving.

So again, bears should be patient here.  And maybe, if they take a broader view of things, they should even take a moment to appreciate what we still have, while we still have it.  How long until the title I gave this piece is more than just words on a page?  

Trade safe.

Friday, March 25, 2022

SPX Update: No Change

A week ago, I noted that if SPX broke above 4416, it was likely to follow through to the upside, and have taken a bullish near-term footing in every post since.  Yesterday, SPX closed more than 100 points above the 4416 level, so we've taken the right approach.  We are in the ballpark of the first red wave 3 inflection, so it wouldn't be unusual for a fourth wave correction to show up soon:


At least, for now we're going to presume that the next correction will be a fourth wave.  As noted on the chart, we are getting into territory where some of the more complex patterns, such as a WXY (which is a pattern that would give bears a larger drop than the mere fourth wave does), at least become possible, though not necessarily likely yet.  Patterns such as the WXY have to be treated as outliers, not because they're impossible, but simply because they show up with far less frequency in these types of positions.  In the end, though, it's often a game of probabilities, and sometimes the roulette wheel lands on 00, even with the odds stacked against it -- which is why I mention these other options, even if I'm not "betting" on them at this stage.

In conclusion, this week has been a hit for the preferred count, and while other patterns are becoming possible, we'll continue to lean toward the "big C wave" count until the market gives us some sound reason not to.  Trade safe.

Wednesday, March 23, 2022

SPX Update: Next Target Captured

Last update opined that the market should continue to trend higher, with SPX probably headed toward the next target/inflection zone of 4485-4505, and that zone was captured and exceeded yesterday.  

Bears trying to understand this rally from a rational perspective might want to consider that we're currently in corporate tax season, and the Treasury typically uses the windfall to pay down T-bills.  Further, they don't need to hold massive Treasury auctions, which means there's more money available for Primary Dealers to pump into stocks.  That may change in the immediate upcoming weeks (which could provide our larger fourth wave; see second chart), but then there's another windfall near the middle of April (which could provide the fifth wave), when individual tax receipts pour in. 

Additionally, even if the market has turned into a bear, it's pretty common for bulls to get a general retest of the previous all-time-high before the next decline gets rolling for real.  This is hardly uncharted territory.

Further, the charts were hinting for weeks that a big C-wave rally was a distinct possibility.  As to where we are in that rally (assuming that's what this is -- and it's behaving like it is, so far):


I backed out a bit on the chart to help illustrate this in more detail below:


In conclusion, there are a couple of oddball patterns that could derail the "big C wave," but unless we see more evidence for those patterns, we'll presume SPX is at least headed for 3/c on the chart above (which will be a more significant inflection), with a reasonable shot at the larger blue 5 and C (preliminary target for that pattern remains 4717+/-).  Trade safe.

Monday, March 21, 2022

The Fed Makes Its Case for a Bear Market

Since December, I've been arguing the case for a bear market via charts.  Today, let's look beyond the charts.

On a superficial level, the case for a bear market is now becoming apparent to more and more people:  Quite simply, the Fed has signaled that it is going to meet inflation aggressively, with Powell repeatedly making hawkish statements on Wednesday.  In fact, he went out of his way to overstate (some might say "exaggerate") the strength of the labor market.  Here's one of several examples:

"Labor demand is very strong, and while labor force participation has increased somewhat, labor supply remains subdued. As a result, employers are having difficulties filling job openings, and wages are rising at their fastest pace in many years.  FOMC participants expect the labor market to remain strong, with the median projection for the unemployment rate declining to 3.5 percent by the end of this year and remaining near that level thereafter."

Pretty strong language -- and he reiterated this view multiple times during the Q&A portion, so it's clear he's trying to focus on factors (beyond inflation) that can act as justification for rate hikes.  Further:

"We know that the best thing we can do to support a strong labor market is to promote a long expansion, and that is only possible in an environment of price stability. As we emphasize in our policy statement, with appropriate firming in the stance of monetary policy, we expect inflation to return to 2 percent while the labor market remains strong. That said, inflation is likely to take longer to return to our price stability goal than previously expected. The median inflation projection of FOMC participants is 4.3 percent this year and falls to 2.7 percent next year and 2.3 percent in 2024; this trajectory is notably higher than projected in December, and participants continue to see risks as weighted to the upside."

So Powell is stating quite clearly that, to quote the man himself, "the committee is committed" to raising rates and attempting to tame inflation -- and the FOMC believes that the economy can handle it just fine (they always believe this).  

Bulls hoping for last-minute wavering by the Fed aren't taking Powell's words to heart.  Powell has quite clearly stated that the free money party is ending.  But it's been so long that many investors may have forgotten that the old market wisdom of "don't fight the Fed" cuts both ways.  

For the first time in a while, the Fed is explicitly warning that they will no longer be backstopping the bulls.

It's also worth mention here that some firms are anticipating upwards of 7 rate increases for 2022 (Goldman Sachs).  The last time we saw that many rate hikes in a single year was 2005 (which saw, if memory serves, 8).  Of course, QE didn't even exist in 2005, so there was no concurrent taper to create additional market pressure along with those rate hikes -- and although stocks traded sideways-up through 2005, we know where it all eventually led.

History may not always repeat, but it often rhymes.

In any case, the point is, the Fed has signaled that it intends to act, and the market is ignoring that for now -- as we suspected it might, based on the potential of a large C-wave rally.  We do have 13 years of conditioning for the market to typically rally on the Fed, and short-covering rallies can be funny and powerful things.

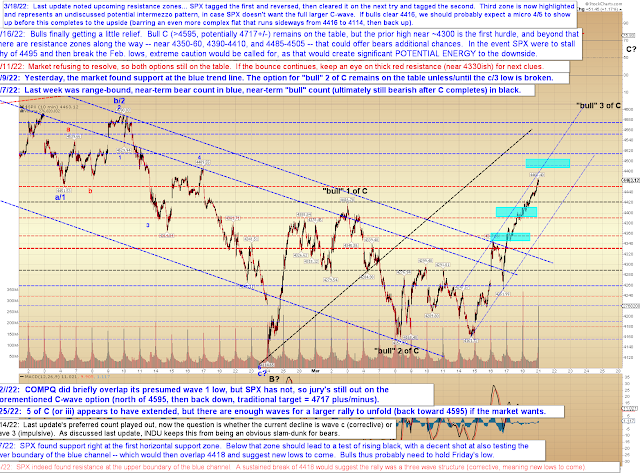
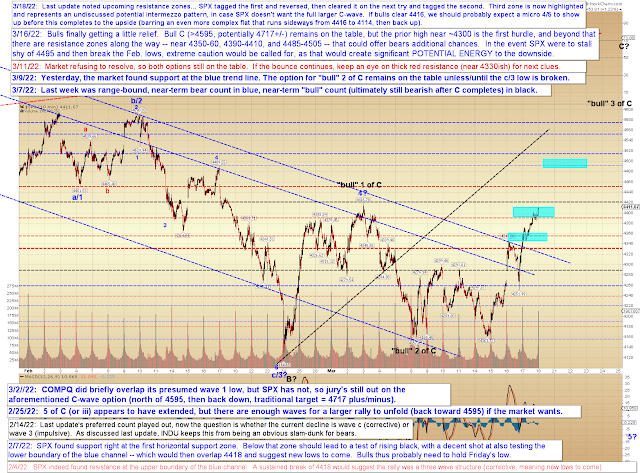
Moving on to the charts, SPX broke above 4416, so this (as I noted last week) indicates that the rally likely still has even farther to go, with the next inflection coming near 4485 -- and beyond that, potentially into the 4700s, so bears may want to continue to show patience.  We are most likely in 3 of C right now, so presumably this pattern will need a fourth wave correction, then a fifth wave up, before there's much potential for a more serious reversal (again, barring some intermezzo patterns that we'll discuss in more detail if it becomes appropriate).


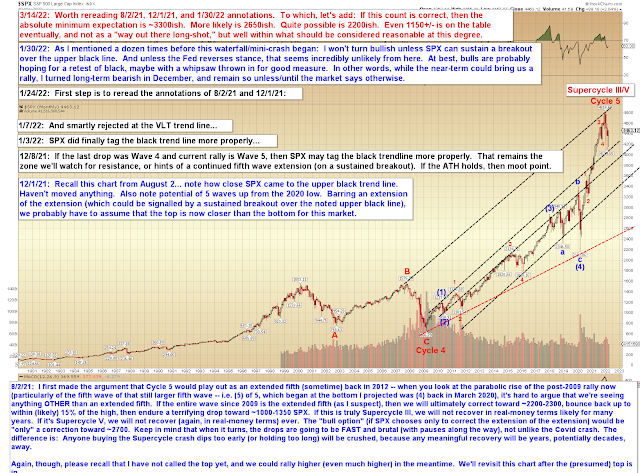
Bigger picture, the most bullish case would be to revisit the very long term upper-black trend line -- but even then, I would remain long-term bearish unless SPX could sustain a breakout there.


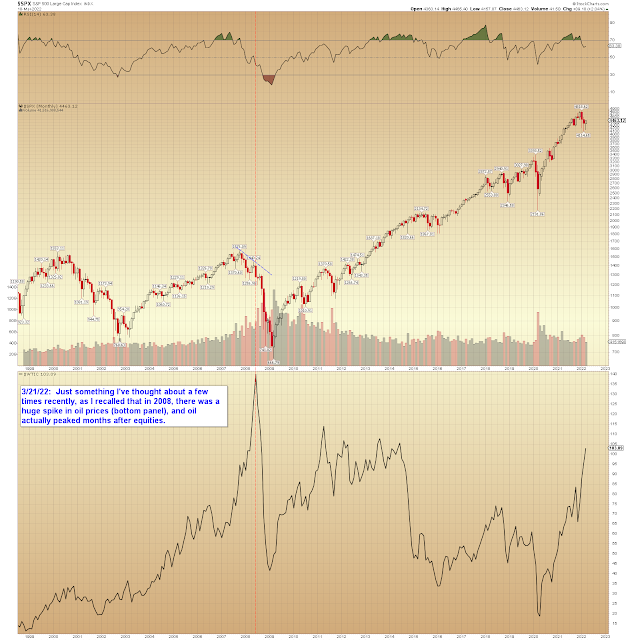
I also wanted to call attention to a comparison of SPX and oil, because recently these two markets in tandem have reminded me of 2007-2008:


Does the above chart mean anything?  Don't know.  But being that I was a heavily-active trader during the 2007-09 bear, the similarity has been on my mind lately.

In conclusion, we should probably expect SPX to at least continue toward the next inflection zone (around 4485), where there are some oddball patterns that could come into play.  If it clears the next inflection zone, then bears may want to continue to show patience, as the potential that we're in a larger C-wave is still very much alive.  Trade safe.

Friday, March 18, 2022

SPX Update

Last update highlighted the next near-term resistance zones, and on Wednesday, SPX rallied up to the first highlighted zone, then reversed.  It did clear that zone on the second try and yesterday, it appropriately rallied into the second zone.  I have added a highlight for the third zone, which also represents the inflection zone (give or take a bit) of an optional intermezzo move, which I'll discuss if it becomes appropriate.


Do note that it's not yet a given that SPX will be able to sustain a breakout over 4416, as there is potential intermediate resistance here:


In conclusion, the near-term zones posted on Wednesday worked well enough.  SPX's next task is to try to clear the intermediate blue trend line, which could, in theory, put up a fight.  We'll see how today's session goes and have another look on Monday.  Trade safe.