Since I covered the bear case in quite a bit of detail on Thursday, today I'm going to spend the majority of the article focussing on the alternate count and the merits therein.
It is simply not possible to see out around every bend in the market ahead of time, so the approach I take is to try to anticipate potential patterns before they occur, and then see how the market responds to validate or invalidate those potentials. This alternate count is one of those attempts, and I think it's a very viable possibility.
The first key to remember is that tops are not supposed to be recognizable until after they've passed. They are supposed to trap a lot of buyers on the wrong side, and they're supposed to blow out a lot of bears in the process (by whipsawing them) -- so that there's fuel for the first round of selling. Some level of ambiguity is to be expected here.
I've personally always found important bottoms to be relatively easy to call, at least the majority of the time -- but major tops are usually confusing places where the market becomes a bit schizophrenic and throws off a lot of false signals in both directions. As we examine the charts today, we can see some of those signals present.
I'm going to lead with the Wilshire 5000 chart to illustrate what I'm talking about. Long-time readers will immediately notice that this count looks a bit weird. It considers the option that wave 1 of (iii) was the extended wave, and the annotations explain the merits of this interpretation. I really like how it lines up all the 2-4 trendlines present throughout the first wave.
This chart took a long time, with liberal usage of the "delete" key, but it still remains the alternate count for now.

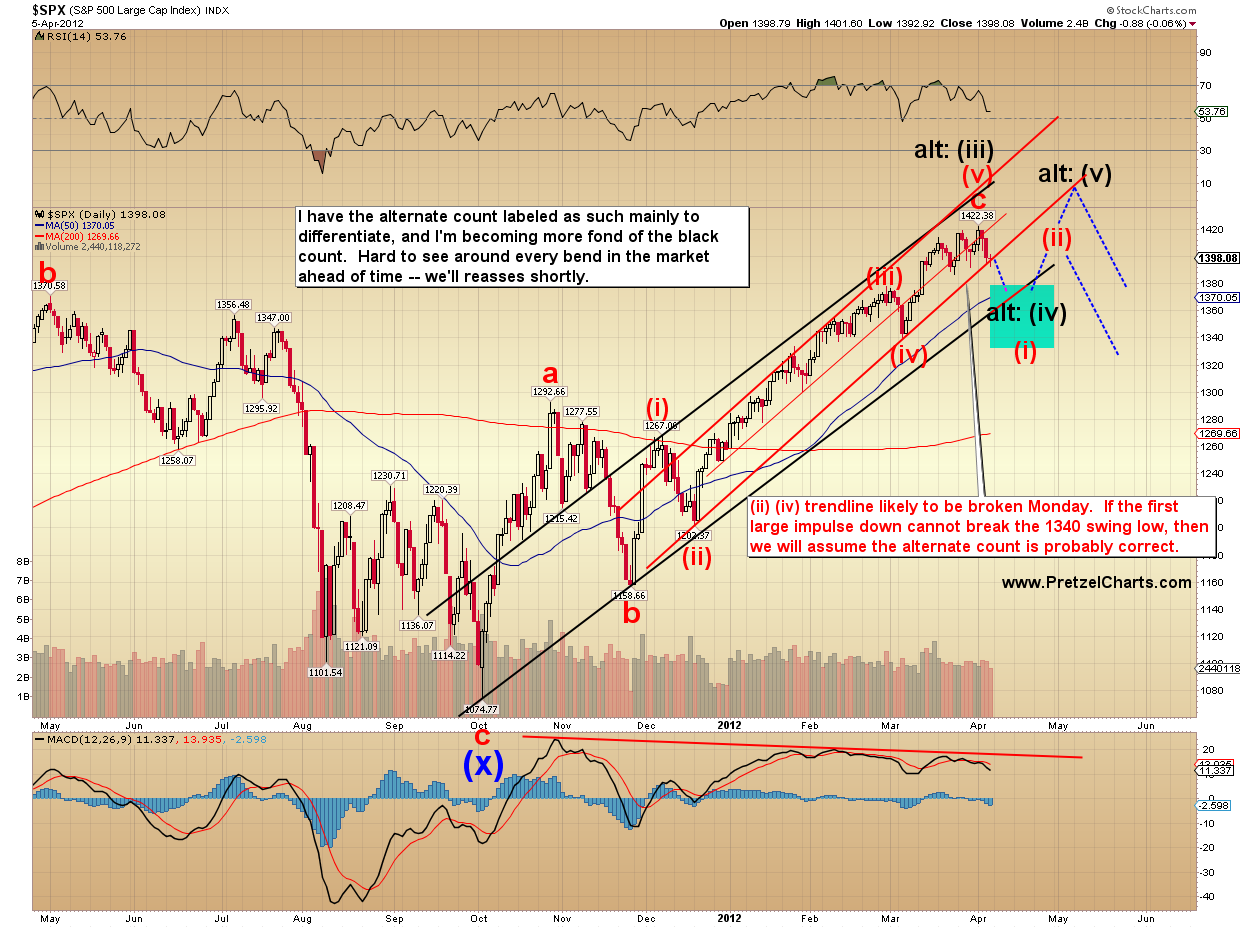
Let's continue running with the alternate count for a moment and look at some of the targets for SPX under the terms of that count. The middle target of a 2.618 extension currently appears the most probable, but we'll have to re-examine as the wave unfolds.

Here's what the alternate count would look like for the bigger picture. I like that it would create a better-looking major top pattern and blow out all the bears who join the fray too late. Note that the alternate count is not long-term bullish, it simply suggests a new high to complete the pattern.
RUT is giving similar targets for the alternate count. RUT has also cracked its major uptrend line, which isn't bullish -- but it's not unusual for one to see this happen a few times as an early warning signal before the final top hits.

Let's throw this next chart into the mix, where my somewhat recently-discovered red cycle predicts a low near April 23, plus or minus a few days. This could fit the terms of either count quite well.

So those are some of the things I'm watching here. The final top may be in, but there are still an appropriate number of question marks surrounding that conclusion. Next, let's look at the preferred count in more detail.
The first chart is a simple analog, and shows that RUT may be building a similar fractal to its last major top.

The next chart shows the SPX short-term targets, which work under the terms of either count. It's possible that Monday's decline will mark the fifth wave of the total decline (black), but I view it as quite a bit more probable that it is actually wave (3) of 3 (blue). 1380 is the first target under the blue count, 1360 is the second. The chart talks about watching momentum for confirmation.
The target of 1350 shown earlier as the alternate count 2.618 extension would work quite well with the short-term interpretation, which is reading this as a nest of 1's and 2's. Because there were no violations of the previous 1 and 2, an extended fifth wave is also valid. The final target for an extended fifth would be 1342-1345.

Finally, an update on CVX. There are two ways to look at CVX here -- there's the hard math conservative way, which says a bottom is close. Then there's the gut instinct way (my approach), based on experience. I'm going to show both views here, but conservative traders may want to opt for the conservative approach and take profits more quickly. Until I see the market open, there's literally nothing backing my read but my gut.
CVX has been a big hit overall, and the trade is already about 6% in profit since I first called attention to it on March 18 -- so there's no need to get overly greedy... but at the same time, one never wants to leave a bunch of money on the table. I haven't called a bottom in CVX yet because I haven't seen one.
If CVX opens Monday down significantly and momentum confirms, then it's likely that my "gut instinct" view is correct and the question becomes whether to take profits near 101 or simply move stops and push for the lower target. If CVX is showing divergences in momentum on the open, then one may wish to opt for the very conservative "wave 5 almost over" approach and take profits quicker.
There is also an even more bearish interpretation which says that 3 and 4 are another 1 and 2. We'll reassess this chart as needed.

In conclusion, referring back to the larger view of the market, there are two main possibilities, both quite viable. There are bearish signals across other markets, which may indicate the market made a long-term top -- but there is enough ambiguity to give me quite a bit of pause, and I feel it's prudent to let the market dictate further before trying to draw definite conclusions.
As I expressed heading into Thursday's close, both short-term patterns expect lower prices directly. The 1350 +/- zone currently seems to be a pretty good final target for both counts, but traders should definitely exercise good trade management until the pattern unfolds a bit further and allows more accurate targeting. We'll reassess all this as the move develops. Trade safe.
Good evening. :)
ReplyDeleteGood morning here! Another Pulitzer winner!
ReplyDeleteAppears we have a huge gap in the futures and Katz thinks more down on the ES first. Any feel here?
Recent days like this have seen us rally back to fill the gap pretty quickly BUT is something different this time????
Been getting stopped often lately.
If this is indeed wave (3) the gap will be left for now -- might get filled in wave (ii) up. If this is 5, it will get filled fairly soon.
ReplyDeleteThanks Pretzel. For some traders April is most likely going to represent a much more 'fun' month to trade than any other in a good long while. Best of success to all.
ReplyDeleteSweeet post PL, at first I was like WTF he threw the bearish count off the table!!?? Then I read it, looked at the charts, and went WTF this guy is a genius. Both counts make perfect sense. I am leaning towards the more bullish count but this week is surely bear week.
ReplyDeleteGotta get some sleep now to witness tomorrows open. Probably will play some puts for quick gains.
Good morning PL. Here's 3 simple charts which look to me have flats as the current structure and which look much better labeled 3-4 rather than 5/top. Just looks better proportioned. And there is no great selling momentum yet, more like a 'what was That?' reaction to the (quite small) drop rather than 'Ok, lets get into really serious selling today'. Against that, INDU is falling- and closing- below any trend line you care to draw and it 'topped' smack on the linear regression line. The others are still above there and haven't yet crossed or closed beneath any significant trend line I can draw. This is typical EWT ambivalance and all 3 could well have topped. Or not. Drives you crazy! Kind regards
ReplyDeleteMorning Jason. Thanks for the post. Can't wait for markets to open. Got two alarms set. Good night - errr... well it's morning... but you know what I mean
ReplyDeleteGood morning RR, here's SPX overnight chart FYI. The volumes are low of course so the momentum indicator is not too reliable as it tends to swing back and forth from each extreme, but it gives a 'look and feel' for the market, just needs a little caution in interpretation. Needless to say it will look different by the time the cash market opens. FWIW I'm trading this as a bounce from wv5 since my read is 1-2, 1-2, 3-4, 3-4 PL triangle, >5. Hope that helps. Kind regards
ReplyDeleteBeautiful analysis PL. It is a great approach to anticipate highly probable wave counts and let the market decide which one is the right wave count. Super idea and excellent work. Thank you very much.
ReplyDeleteUK, how did you like my WLSH chart? I know you're a 2-4 purist, so I thought you'd enjoy that one. :)
ReplyDeleteThanks, Ray. The big challenge I've found is presenting it without it getting too confusing, especially to the non-Elliotticians. And trying to cover all the "stuff to watch for" at the same time. Sometimes I can pull all this off, other times I can't. :)
ReplyDeleteMorning Mad Max. MMM for short. ;)
ReplyDelete"Tanks" AR. Should have some good volatility if nothing else.
ReplyDeleteExcellent post PL...very nicely presented...not confusing at all...Thanks.
ReplyDeleteThanks, jbg, appreciate the feedback. :)
ReplyDeleteES/120
ReplyDeletehttp://screencast.com/t/msEM587YvCd
Hi PL, well - I said to myself, the guy is showing some promise after all ! :O .... I've never looked at WLSH and it looks too complex to start at this stage but I just lurv those 2-4 lines... and as in the charts I posted the (red) count looks the part and the top is not yet in. If the facts change then I'll change my mind of course but for now I'm assuming 4th waves all round, with INDU on 24 watch. In view of every indicator known to man on this earth and every other planet stuck hard against the stops, I can't see how these markets keep climbing, they must be filled with helium or full of anti-gravity... amazing. The other slight niggle is that Dr Nenner forecast 1440 and 13400 this week (he passed on NDX which he said had already exceeded his target [and everyone else's I imagine]) so I'm not quite ready to go short in any meaningful quantity. Gotta have some confirmation. But this week looks critical yes? Current SPX chart attached, FYI. Just possible there is a (tiny) flat there at the bottom so ? more down to come ? before a good bounce. Kind regards
ReplyDeleteThanks much Katzo.
ReplyDeleteI thought AAPL WAS the market K7. & 56 out of 57 analysts were bullish on AAPL (earlier post) so if you are contrarian it might be a good time to dig out that bearskin coat :)
ReplyDeleteHonestly, I'd feel better if the 1440 area was hit too. Better Fib numbers, plus long term resistance. How do you get current SPX charts while the market's closed, btw? ;)
ReplyDeletea good chance we reset to 86 to 98 area, any break of 79 will set this off. IT direction is still down with ultimate tgt at 68-9 ES. this will be an up corrective move and strength oscillators still hugely pointing to the down side.
ReplyDeleteExcellent post PL. It's always good to challenge assumptions and look at things from a different perspective. Bringing forward to a wider (Monday) audience... "Here's something I've been working on to help learn EWT. This is a macro-enabled Excel workbook that validates a simple impulsive wave followed by a corrective wave. It doesn't identify waves but it does validate them against the most basic rules. For instance, if you enter a Wv. 3 that is shorter than Wv 1 and Wv. 5, the workbook will call it out. The specific rules and the sources are listed on the 'directions' worksheet. It also identifies likely targets for waves proceeding from wave 2. Since Disqus can't handle non-image types of files, I opened an account at MediaFire (recommended by LifeHacker). Media Fire scans all attachments for viruses. http://www.mediafire.com/download.php?1gt4sgjwdt1gcwc Hopefully, this will help someone."
ReplyDeleteAAPL was going contrary to mrkt direction up to now, based on the 120 chart. That I think will now change.
ReplyDeleteThank you WS...downloaded and scanned...gonna play with it as my EW edumucation moves along.
ReplyDeleteVery Nice article - well written and easy to follow to conclusion. Wish I could hand around more but gotta go to work - all y'all have a great day and make some money.....
ReplyDeleteHi Katz! When would you expect the upward reset to begin? Probably before RTH right? And when/how could we get clues that this reset may not happen after all? Thanks!
ReplyDeleteDefinitely pulled it off. Excellent post!
ReplyDeleteThanks Whip....marvelous app, gonna play all day with this. Gonna whip it......whip it good!
ReplyDeleteGhost spike in SPY (pre-market) points to a possible retest of ES = 1371.5 to 1372
ReplyDeleteNote that it could get there and just keep on going, per PL's targets.
AAPL downgraded.. gap fill time?
ReplyDelete1379 ES break will initiate reset.
ReplyDeleteEmployment to population ratio chart, BofA.....
ReplyDeletehttp://www.zerohedge.com/news/dont-show-chart-president
The way I look at it PL is :- SPX gained on average 0.26% per day from 19 Dec to 2nd April. 1440 is 4.3% above today so we are at least 16 days away from 1440 at best. 5th waves are much slower as momentum dies so add another week to say 21 days. The maths are agin it really unless you believe the top is 3 weeks away, but markets do what they want so... even though it looks impossible to my eye, who knows? No confirmation of trend change yet. The charts BTW come from CMC Markets but I don't think you guys are allowed to access them are you, being a gambling site - as your government sees it? But I understand changes are on the way. What I want today is a good bounce, but I remember that 60% of the time a market opens down it closes down, so we'll see what happens.
ReplyDeletePL...was the opening on CVX the third wave, of the third wave of the fifth wave of Wave 1 down?
ReplyDeleteMost bearish case: wave 1 of five of one just finished.
ReplyDeleteThis wave 1 is 22 points (do you count the start at wave 4 high? or when wave 4 consolidation ends?), which probably means it is the longest.
Wave 3 will start 1.5 hrs before close from all the traders on margin starting to deleverage and rebalance. That probably means a good selloff into the close and on tomorrow's open, so wave 5 has a chance to be shorter than it.
After writing that, I can see why PL likes the bull count. I do too - I mentioned the other day I didn't think it "felt" right. I think the bulls need a push up from decent swing lows to say "I told you so" and get super complacent. They haven't had a serious test yet and they know it.
So it's only going to 999 instead of 1001?
ReplyDeletejust went up 1% double quicktime.
ReplyDeletecould you post your chart MM please, 1 picture = 1,000 words :) ty
ReplyDeleteINDu and SPX are sitting huddled doing nothing (?shell-shocked?) whilst NDX and AAPL power ahead. Any ideas why guys?
ReplyDeleteFull disclosure: I have no idea what the nomenclature is supposed to be: V/iii/(iv)/5/(2) etc. but I think the nesting is obvious in the chart.
ReplyDelete1000 words attached.
BTFD - not likely to see AAPL hit 625 again on its way to 1000
ReplyDeleteAAPL ending diag MM? correction ahead?
ReplyDeletePL.....score is GUT = 2, MATH = 0 ( I think I see a trend developing)
ReplyDeleteRight now we have a dead R2K, a confused ES and a determined NDX (powered by AAPL, resilient in green territory while major indices are all red). NDX futures are now approaching the critical level of 2746. If crossed, it will probably bring other indices up with it. The next bullish objective would be printing a high higher than the previous (2761.39). However, if/when a reversal takes place from here (as it seems it is...) or from the ~2746 retest level, even not touching 2746, the thurst down could be intensified. Channel indicators still pointing down. This week will be probably driven by news, I guess. Any hint of QE3 from this week's several Fed executive speeches may fire up markets again.
ReplyDeleteLinear regression line? that seems like an oxymoron to me. I don't trade or chart aapl because I don't understand its appeal and I probably would let my ego and dislike for the company lose me money. I just watch the price of it 'cause it's a major playing in the SPX and NSDQ
ReplyDeleteSeeing the two parabolic leaders AAPL and PCLN so strong today actually makes me more bearish on the markets. Granted, they might lift the markets a little more today, but this isn't how they will look in any type of panic bottom on the markets. These have to break at some point, and that will likely take the markets much lower along with them. I am short some QQQ's small as a swing trade, and my target is to cover when AAPL takes out its lower Bollinger Band (a ways down!). I also just put on a small AAPL short as a stab at top fishing, with new highs as a stop. Tiny risk for good reward.
ReplyDeleteAnyone else feel this way also?
me too
ReplyDeleteright now looks like they are drawing a wv1 with NDX having 5 clear wvs up and a retrace to 50%.. so far so good. More to come I hope.
ReplyDeleteKatzo, if I remember well, you predicted AAPL reaching a target of 636 before selling off. Well, it did this morning. Can you share the rationale behind this level and what you expect going forward?
ReplyDeleteAAPL appears to be grasping at straws, but it has been doing so for a while and has not stopped. I agree with your analysis, the question is when/where will AAPL stop. When it does, the downturn will accelerate.
ReplyDeleteAgreed Authentic, the downturn should accelerate markedly if they break. Fwiw, I just shorted a teeny tiny bit of PCLN too. I guess I really feel like playing with fire today! :)
ReplyDeleteES down 1.13%, my 79 level held so forced the down move.
ReplyDeleteTVIX up ~10%, research of it was spot on.AAPL double tapping 636, think that will be the top for a while.$RUT up 2%, TZA in context up 6%
Hi GP,
ReplyDeleteThere is divergence on the 120 between the EW3 and 5 on the 120. But the strength oscillators have not backed off on the larger time frames, so the top is not in. EW4 retrace (DAY chart) to about 525 to 575, will hone in on better tgt once the turn is really in, then more up.
I also think that AAPL is going parabolic, but it still has more to go! It's likely that AAPL will have very good earnings for Q1. Apple began selling iphones in China since January, and this can help boost earnings. Apple's competitor, Samsung, announced record quarterly smartphone sales on Friday, and their stock jumped 25%. It's difficult for AAPL to drop until there is earnings weakness. So for now, it's quite risky to short AAPL. We'll see what happens after earnings announcement on 4/24.
ReplyDeleteSorry for the noise.....did not see your comment on the previous thread. I am following you and will not send "time consuming" redundant posts. My apologies.
ReplyDeleteTrying to provide the best real-time commentary I can, think this ST down is finishing up, it basically is getting frustrated from not going lower to the tgt of 68-9 immediately. Good chance of it heading for 1385 ES in early afternoon, this is what I saw pre-bell but timing was off. Again, a break of 79 and 85 comes into view. Trend still very much down but a trip to 85 does not insure we will fall EOD, could just get really weird.
ReplyDeleteThanks, Katzo, much appreciated. I agree with you - AAPL is still trading close to its upper BB (daily chart), no meaningful sign of weakness yet.
ReplyDeleteSpeaking of weird......Bonds (TLT) up $2.79 or 2.5%
ReplyDeleteNenner:
ReplyDeleteS&P/Nasdaq
Our
overall technical model is still getting weaker
The
S&P missed our upside price target by 2%
We
are close to the projected cycle top
It
is important for the S&P not to close below 1370
Gold
cycles are still projected to bottom by mid APR, while Silver cycles bottom
this week
A
close for Gold above 1690 and Silver above 32.80 will be a short term buy
signal
Crude
The
short term cycle in WTI Crude continues down until the end of the week
the
weekly cycle bottoms this week and the weekly Crude cycle tops in MAY
close
above 106.80 will be a buy signal
US
Bonds
Bonds
gave a buy signal on Friday
A
close for the 30 Year above 141.20 and close above 131.08 for the 10 Year will
get us
long
with a tight stop
Euro
If
the Euro can close below 130 EUR/USD, it will project to 128 EUR/USD
It
continues on a sell signal
+3 ticks in SPX in 3 hours.... ??? 4th wave ???
ReplyDeleteGP I hope people don't get ticked off at me for continuing to bring up this issue, but the ratio of AAPL to NDX is a real "tattletale" for lack of a better word. Right now AAPL is 'still' outperforming, meaning that it's the biggest horse that's hitched to the wagon and it's pulling for all it's worth. When that big stallion starts to falter (not pull as hard as the other 99 horses in that index are), it's all over for the NDX. So far that's not the case:
ReplyDeleteThe AAPL:NDX ratio
And here's the key chart from that study:
http://stockcharts.com/h-sc/ui?s=AAPL&p=D&b=3&g=0&id=p94693717659&a=257706301
Of course this isn't much help from the perspective of trading AAPL itself but that's not what this particular study is designed to do. Its purpose is to betray when a big meltdown in the NAS 100 is imminent.
Thank you, Bob.
ReplyDeleteGlad to and you are welcome.
ReplyDeleteUh oh... Pretzel would you mind checking the spam bin when you have time? My reply to Katzo and GP regarding AAPL is in there. Man, is it any wonder I've got such a hate-on for trolls? They didn't do that here, it's just the side effect of another site where the owner doesn't even have the common courtesy so correct Disqus by teaching it which comments are real spam and those which are innocent. Infuriating to say the least. Which is also why I get so infuriated when the most destructive troll on the internet commenting on this site. Haven't seen him for a while though so maybe he's banned here.
ReplyDeleteFeels 4ish doesn't it? I'm wondering if it will bounce off the 1387 area and head down for 5. Just one possibility of too many.
ReplyDeletekatzo- thanks for sharing. would this retest of es1385 be w4 on your (& PL's) chart? I suppose w5 is still to follow if it fails to break 1385 or doesn't get to 1385 at all? sorry for the newbie question.
ReplyDelete2746 is the current price channel center, where retests usually occur. If crossed, previous uptrending is resumed. If failed, a confirmation of the downtrend is in, and an accelerated decline may be expected. Vice versa is valid when prices move in the opposite directions. Assessing new highs and new lows along with this price behavior within channels is as important. So right now, in this example, we have NDX (2743.6 as I write) very close to the retest area after having printed lower highs and lower lows.
ReplyDeleteup not over
ReplyDeleteabsolutely correct....
ReplyDeletees hit 79 in a strong up thrust, resetting to 88 in progress, probably towards the end of day, or even earlier? I presume that would be wave 4, and w5 coming tomorrow??
ReplyDeleteyup, very possible
ReplyDeleteOil down dramatically on ST analysis and breaking below previous lows. In the IT/LT I feel it will continue down, but there will prolly be a ST bounce of USO to about 39 to 39.25 to fill gap. Big question is 'did oil break the back of the recovery'?
ReplyDeleteChance ES reset done to only 80, it might have just run out of up power, a sudden drop will confirm.
ReplyDeleteVIX option report
ReplyDeletehttp://www.youtube.com/watch?v=KqnRiHy79LY&feature=plcp&context=C4558477VDvjVQa1PpcFP8gF6YbVbpVy4YB9mvfz9U3bbEUuLtU7s%3D
anyone else think W5 just started?
ReplyDeleteIMO high of day is behind us and we will close near day's low or lower. KO for this theory is sustained trade above ES = 1380
ReplyDeletehey pretz, great post! somehow my post (uploaded through my mobile device that has the symbol of some sort of fruit... ;-) ) never got posted here. Anyway, in short my reply was: "WTF PL went bullish" then I read you story, looked at the charts and went "WTF this guy is a genius. Both bull and bear count project same short-term levels, makes so much sense since that will screw 'em all." Anyway, time will tell which one will be favored. I am leaning toward the intermediate term bullish count. Downside not as strong as I thought it be today (thanks to that fruit!) Anyway, keep up the great work!
ReplyDeleteGreat article, PL. I appreciate the pragmatic and TA integrated approach.
ReplyDeletejbg, Enterprise is in the house. Saudi Arabia's flood of oil has arrived in the U.S. Let the games begin. : (
ReplyDeleteCould be nicely proportioned INDU and SPX 4 waves down, so far, 5th just starting. ?
ReplyDeleteyep, see post above A1
ReplyDeleteyep, see post above t29
ReplyDeletelooks like it sb, see post above
ReplyDeleteAAPL going nuts!
ReplyDeleteGot a dumb question for the veteran's futures traders. I made my first live futures trade today, entered at ES 1375.75 -- I overslept -- with a target of 1380. When I set my limit order at my target price there were no other orders showing on the DOM at 1380. Then I saw 1380 get hit 6 times without giving me a fill and we're talking a single contract. Is that normal or should I be looking for another broker?
ReplyDeleteIt's holding above 1380 and VXX is dropping, so I am staying out.
ReplyDeleteAre AAPL and QQQ 'disconnecting' as this chart seems to suggest?
ReplyDeleteIf you have a limit to sell at 1380, trade must reach at least 1380.25 for you to get a fill. A guaranteed fill would be if trade hit 1380.5, as that would mean that ALL sellers at 1380 were exhausted.
ReplyDeleteDefinitely seems that way.
ReplyDeleteHas COMP made a truncated 5th?
ReplyDeletecool chart GP, ..disconnect... >> trend turn?
ReplyDeleteOK, thanks. I guess the "realistic fills" option in the demo account isn't completely realistic.
ReplyDeleteOf course when I finally got tired of waiting and decided to settle for 3 points, it blew through my original target and hit 1380.50 like two minutes later. But I figure 3 points is 3 points and no one ever went broke taking a profit.
Does anyone have an EW count for the TVIX?
ReplyDeleteme too C3861, w5 next down.
ReplyDeleteGood trade. In the future, if you want out at 1380, try placing your limit at 1379.75 or 1379.5 to ensure a fill when it approaches and maybe just ticks once at your target.
ReplyDeleteEW experts: so this w4 (on spx) looks 5 waves up? could it be a of 4 & b to come? thanks in advance!
ReplyDeleteGP I've tried to reply to you earlier buy some of my comments end up in the spam bin, particularly if I try to edit them. I'll try it again. I follow the AAPL:$NDX ratio like a hawk because of it's value in revealing when the power horse is beginning to falter relative to the other 99 that are hitched to the old stock wagon. Here's the write up on it:
ReplyDeletehttp://albertarocks-ta-discussions.blogspot.ca/2012/02/leadership-of-aapl-potentially-dire.html
And here's the key chart from that analysis:
http://stockcharts.com/h-sc/ui?s=AAPL:$NDX&p=D&yr=0&mn=11&dy=0&id=p43653801308&a=259988082
Bottom line is that until we see the moving averages on this ratio start to keel over, the biggest horse that's hitched to the NDX 100 stock wagon is still pulling more than his weight. Once he can no longer pull as hard as the other 99 horses do on average, the NDX will be toast, because this is one monster sized horse.
I realize this isn't directly related to your situation if you are actually trading AAPL though. This is designed specifically for the purpose of identifying the day when the key stock in the entire NDX is going to let it slide. I hope this helps a bit.
ty GP, appreciated your reply, adds to my knowledge.
ReplyDeleteUnfortunately I have to give up trying to reply to you with a link GP. This is the third try. All I can suggest is that you might want to click my name and search for the article entitled "The Leadership of AAPL - A Potentially Dire Signal Is Issued". It was published Feb. 15th. I've been trying to show you a chart from that article this morning but the damage caused to me by trolls on another site is now firmly embedded in Disqus. If the owner of that other site would only be as responsible as Pretzel and clean up his damned spam bin I'd be away to the races. My apologies but this is the only way I can even get a message to you 'at all' about the AAPL:NDX ratio. It's a key measurement to be aware of. It doesn't necessarily answer the question about "when is AAPL about to crumble" though. But it does identify when AAPL, even though it might be rising, isn't rising enough to save the NDX. I hope it helps in some way.
ReplyDeleteThanks A1. I actually almost did. I didn't like putting a target at a decade number. It seemed like the best compromise when I did it. I was pretty sure it was going higher than that today but I didn't want to get any greedier than 4 points plus commissions.
ReplyDeleteDitto
ReplyDeleteHiya NJ, should look something like this, but EWT can be very ambivalent so always use caution and always confirm the move you recognise.
ReplyDeleteAR and UKDNY, this is precisely the key take away from observing the AAPL:NDX ratio, imho. My reading is that the weight of other index component companies' recent underperformance may be becoming more relevant that AAPL's continued overperformance. Or, as you said, AAPL may not be rising enough to sustain NDX anymore. And I agree that this does not yet give any indication indication of where AAPL could get. I still see AAPL driven now more by speculation in the options market than the underlying stock performance itself.
ReplyDeleteplacing exits at round numbers is one place where the herd mentality rules. Being a quarter above is kind of like fighting city hall...... Have to pick those battle carefully... LOL
ReplyDeletenot oil - gasoline prices
ReplyDeleteHi UNDNY, thank you so much! wow, market is playing your script now:-)
ReplyDeleteStochastic Momentum Indicator is as low today as when this surge first began 27th Nov last year.. in SPX and INDU. NDX ws a little later on 15th Dec. Something's going on.
ReplyDeleteLooks like 1393 EW was top, that held nicely
ReplyDeleteINDU Ichi Moku . Not looking good for the bulls. Not good at all.
ReplyDeleteYeah, there's no doubt about it, AAPL is a stellar corporation. It's not as if the NDX was being led by a humungous corporation that was priced at 135 times earnings like AMZN. So it stands to reason that it should be seen by portfolio managers as a "must have". But from my perspective... all that argument is just noise because for whatever reason, once AAPL starts to lag the NDX, it's all over. I don't care what the reason is... it works.
ReplyDeleteis this the 5 now? kind of running out of time...what is the target for w5, still 68/9 or even lower?
ReplyDeleteAAPL ending diagonal?
ReplyDeleteyeah, running out of time and tgt still same.
ReplyDeleteSame for NQ100 futures around 2746, for now.
ReplyDeleteWorking pretty well, per your chart. VXX taking off after 3PM, confirming it.
ReplyDeleteToday was a very good day for continued bear case, always a period of rest after big interday moves.
ReplyDeletehttp://screencast.com/t/KDRhtxxWunsF
Quietest I've ever seen this board.
ReplyDeleteI have a bad feeling about this.....hairs on the back of my neck are standing straight up.
ReplyDeleteUVXY ended near HOD, in fact it made higher high the last few minutes of trading which is extremely unusual for this beast, even though spx was still 5 points above the LOD. More firework to come? TVIX is somewhat a wild card now since it is still trading above NAV.
ReplyDeletebe interesting to read PL's take on today... this move was one of his scenarios... things are hotting up!
ReplyDeleteThe red circles in this NQ100 futures chart (5-hour bars) represent support and resistance within price channels, as determined by moving averages and their envelopes. During uptrends (channel envelopes pointing higher), the 40-period line (blue) often provides a better retesting support level, thus offering an opportunity to go long. In downtrends (channel envelopes pointing lower), usually faster, the 20-period line (red) provides a reasonable retesting resistance level., and therefore an opportunity to go short. Analysis of new prints of highs and lows is as important, along with wave analysis and Fibonacci retracement levels, among several TA techniques. I also look at the relative position of daily bars (cash) within Bollinger bands for an additional insight. As futures are continuously traded (Sun-Fri), I prefer them for this type of analysis. Again, no intention to provide any trading advice.
ReplyDeleteStochastic Momentum Indicator for INDU was +78 6 weeks ago, today Minus 68. SPX was at an extreme of +88 on Mar 18th and was last that extreme 3 July 2011. Today's low was Minus 72. It was last that low on 21st Nov 2011. (anything over 80 is extreme, 70+ is just very very high!). Now things are extreme there will be a bounce, can't say when, could be tomorrow but there will be one. Momentum is swinging from up to down. Seriously. IMHO.
ReplyDeleteexcellent, good to have another market confirm, adds to confidence. ty
ReplyDeleteHi SB, SPX turned at 1387.15. WOW!. Deep respect dude. Hope PL noticed that great call ;)
ReplyDeleteThanks for the info doctor.....putting on my flack jacket.
ReplyDeleteThanks for all of your input today UK. Very helpful.
ReplyDeleteIt'd be a crappy way to get my old screen name back, but what's a guy to do. I've been playing $RUT TF all day on paper. Fib #s, TL's and BB's totally ruled the day. When I wasn't trying to out think the obvious entries and exits it went friggin' awesome.
ReplyDeleteGood afternoon PL. Good day at the office yep for the bears? And :-You may not have noticed but you have a genius on site. Snowbeast posted early and called for SPX to turn at 1387. On my chart it was 1387.15. WOW. What a call. lol
ReplyDeleteI was focusing very very hard. Phew.
ReplyDeletetime to lather up and shave. :)
ReplyDeleteToday's close below 1384, which is "long-term" trendline (at least for this rally of the Oct/Dec '11 lows) suggests more selling IMHO. 23.6% and 38.2% Fib retrace off these two levels from the past week's high confluence at 1340 and 1338, respectively, which also coincides with the early March low of 1340. Seems like waaaays to go, but logical "resting point" IMHO. However, first things first; 50-d SMA is now at 1371.33. That be serious testing grounds.
ReplyDeleteI agree though that a bounce should happen somewhere between now and then.
In 2011 there were 2 drops and climbs of about 100 points (SPX) before the market finally fell. At the 2007 top there was a swing of about 180 points. In 2000 there were swings of roughly 130, 170, 100, 100, and 100 before the market finally fell for good. If we are at or near a top I wouldn't be surprised to see some larger swings. This would likely also cause maximum pain and frustration.
ReplyDeleteAAPL/120 ~ would like to see a conclusive candle on the DAY tho
ReplyDeletehttp://screencast.com/t/RERMka3D
TVIX/30, tgt 10-12
http://screencast.com/t/7Xs8bIYZ
LOL! I was watching PL's 2nd to last chart combined with a trend line extending from the October and December lows. I might actually be learning something from you guys :) Someday I might even make back all the money I lost when I first started this gig. Definitely a genius.
ReplyDeleteHi Katzo7,
ReplyDeleteThanks for the TVIX update. Went long last week - hope for some volatility to continue!!
Good evening PL. Had a look at RUT for the first time and drew the Ichi Moku chart. 6 indicators point down, but not yet terminal. If it gets to 770 however I doubt it would get back above the Cloud barring a miracle. Could be, but of low probability IMHO. Looking forward to your post tomorrow... a very interesting day I thought.
ReplyDeletebear flag, 15 min. ES?
ReplyDeleteDon't forget the helmet and goggles 'cos when the pineapple hits the fan.... gonna get messy Bob_E lol.
ReplyDeleteReminds me of when we first visited Oahu many mooons ago now, it was raining. I said to the taxi driver 'it's raining dude, where's the sun'. 'Nah, that's not rain... it's pineapple juice!' Got a good tip. lol
Hi AR. If you take a loook at AAPL right now I think you might see an ending diag which would point to some sort of reversal 'real soon now', & once it cracks ... could be the end?
ReplyDeleteSnapshot on NDX (Nasdaq 100) as of today's close.
ReplyDeletehttp://www.nasdaq.com/quotes/nasdaq-100-stocks.aspx?col=4&dir=D
I agree Katzo. Also, we topped out right around a 50% retrace from Friday's high to Sunday's low. Very bearish in my opinion. Also, as I noted earlier, it seems bearish for the markets that they are this weak even with AAPL and PCLN still parabolic and making new highs. Imagine what could happen to the broader markets if those two break down hard.
ReplyDeleteBob: did Nenner give a downside target if the SPX does close below 1370?
ReplyDeleteYes, it waited until the last two minutes and then, contrary to the norm, it went up nicely (for me). Not sure why it disconnected from the S&P at that point.
ReplyDeleteI look forward to joining you in making back on the money I lost when I first started.... :)
ReplyDeleteI'm pullin in the sandbags good doctor. Figure 2 to 3 weeks of front running "sell in may" and then the final push to new highs before the election. You can quote me....but don't spread it around over there in Merry Old England. Looks like Nenner's gonna miss his 1449 target in April. As the old saying goes, "I'd rather be lucky, than right" With PL as my our rabbit's foot.....what can go wrong. (hope murphy didn't hear that)
ReplyDeleteHi Katzo,
ReplyDeleteThanks for your AAPL updates. I entered a Bear Call spread (145/150) earlier today. Risky play, so I'll be watching closely for a stop out.
Hi SSU,
ReplyDeleteGreat analysis. I agree with you. I trade a lot off MAs. Question, I was taught to use EMAs for 10, 20, and 50-day, and SMA for 100 and 200. Was I taught wrong? WDYT?
TIA
You should have that Itchy Moku looked at, because it can spread otherwise. :D
ReplyDelete$RUT/D, down 1.80% today. . .
ReplyDeletehttp://screencast.com/t/ej5HBJFvs
Sorry, I was actually up most of the morning, but I was extremely intent trading DX all day.
ReplyDeleteme 3 :)
ReplyDeleteLOL... taking note here:-)
ReplyDelete& your call/chart half hour before close was prescient.
McClellan Oscillator ($NYMO)
ReplyDeletereads -76.92, very close to -80. In the past (Mar 7 included) most time when it hit -80 a rally would begin. this time it may confirm PL's primary bullish scenario?
?
It stuck to the Fibs and BB's nicely
ReplyDeletehttp://screencast.com/t/n8Pu05BiPuo
PL, haven't gotten through all of tonights post, but had a question about the first spx chart and the comments about the yellow being impulsive and the blue being 3 waves. You mentioned that the high couldn't be the corrective wave. Can't a B wave in an extended flat be higher than the origin of A, which in this case would be the top of wave 5 is already in? sorry if i'm way off base, just been trying real hard to understand this EW stuff for the past 6 months. thnx for your hard work
ReplyDeleteoops, i get it now. if it was really the top, we'd be starting 5 waves down, not an expanded flat. sorry for jumping the gun.
ReplyDeleteOn the one hand they tend to be tough nuts to crack. On the other
ReplyDeletethey're like magnets. You get close to one it always gets hit. My bad
was I thought it mattered when the order went in in.
Anyway I guess the two lessons there are, (1) I'm pretty sure I could have gotten
79.75, an hour before (2) I finally blinked, literally a minute too soon,
waiting for 80 and (3) first come, not first served.
We have seen this before - I was reviewing the SP daily bar chart from 10/24 through 11/28. They are very similar in structure to what is going on now. That was about the time if memory serves me correctly that everyone was trying to figure out how the triangle would resolve. The bars for 10/27 through 10/31 are very similar to 3/26 through 3/29 and the move from 11/11 to 11/18 is very similar to the move from 4/2 to 4/9.
ReplyDeleteNagging dream last night. I saw this and started to sweat....possible ????
ReplyDelete3/15......$109.50 = a
3/19......$111.06 = b
3/23......$104.85 = c......A
3/27.....$108.00 = a
3/29.....$104.92 = b
4/2......$108.79 = c.......B
Decline from 4/2 high in five waves = C @ $101.15 (1.618 length of A)
Q: What's the most interesting thing about this chart?
ReplyDelete(Hint: It's a tick chart.)
Good doctor.....I have been toying with the idea that we have seen this movie before and I seek your help in review using IchiMoku. Technically, I believe we are now in the same condition or status as we where in the 2nd and 3rd quarter of 2009 and also the 3rd and 4th quarter of 2010 (SPX and DJ). Can you cast your watchful eyes over those time frames and see if the similarities are more than just coincidence? My suspicion is, based on similarities, we hold at 1340 and then put in new highs around 1508 before the elections. When you are able....
ReplyDeleteLow volume on late rally?
ReplyDeleteYou're warm. On a tick chart every price bar represents the same number of transactions. So volume means something subtly different than it does on a time chart.
ReplyDeleteCould a second diamond in the $RUT be forming?
ReplyDeletehttp://screencast.com/t/2aEcYjvrWFd
Sorry - small transaction sizes - retail investors
ReplyDeletehttp://emini-watch.com/emini-trading/tick-charts/
ReplyDeleteRegarding reason #2 on this link, how does the author have any idea when the amateurs are shorting?
What does it mean? How does it show direction of market?
ReplyDeleteJust sold my long TF's purchased at close.
usually another break but it's a 50/50 on direction.
ReplyDeleteThe Nasdapple is developing one also
http://screencast.com/t/IxSPolHD266
HFT pump?
ReplyDeleteExcellent question. And I don't know the answer. If we had volume at bid and ask it would give us a better clue as to who's doing what. I guess could switch to TradeStation and buy emini-watch guy's indicators, and I may at some point. But in the mean time, one could just ask who buys bigger lots and who buys smaller pieces and who tends to buy near bottoms and who tends to sell them.
ReplyDeletePL's update will be interesting. Not much positive news to rally on but a huge gap to fill.
ReplyDeleteAlcoa might be a trigger but don't they usually disappoint? And aluminum hasn't been great lately.
We live in fun times....that gap...yeah, that gap. Alcoa reduced their capacity 8 or 13% from last quarter but there might be a lag for decreased orders catching up with their quarterlies. We'll find out.
ReplyDeleteFor sure it would be a bad signal once AAPL 'really' starts to roll over, complete with moving average rollovers and a trend line break. Once that happens, it's still entirely possible that even as AAPL is falling, it's still<.u> outperforming the NDX. But the charts show that that situation wouldn't last very darned long. So AAPL would begin to under-perform the entire index which means the biggest horse that was at one time pulling the entire stock wagon uphill is now pulling it downhill. So it quickly becomes a snowball with the NDX falling partially due to AAPL's decline, but APPL falling even faster, lol. You bet, according to past history of this particular ratio it should be the beginning of a rather hefty decline.
ReplyDeleteJust on a side note, I did the same analysis for the DOW and the biggest horse in the DOW, which is IBM and the ratio does not work out nearly as well. I think that's mainly due to the fact that IBM is kind of like a big fat slug.... just so "unvolatile".
He has volume at bid/ask in TradeStation. I think with my broker I could probably get upticks and downticks, which are not quite the same thing but might be more useful than just plain "v"...
ReplyDeleteWhat was Dr. Elder's line? Something like, "For years I chased diamonds but I mostly ended up with cubic zirconiums."
ReplyDeleteNasdapple. I love it.
ReplyDeleteLOL...so did my first fiance`
ReplyDeleteno i dont think so. EMA just put more wait on the most recent price change than the SMA, so it changes faster. all depends on your time frame and comfort level of when to go in or out. good luck!
ReplyDeleteWorth a chuckle or two, perhaps even a guffaw.
ReplyDeletehttp://www.marketwatch.com/story/you-are-the-best-predictor-of-next-bull-or-bear-2012-04-10
Agreed. 3.87/gal gas.
ReplyDeleteMcClellan is calling for this move.
ReplyDeletehttp://www.mcoscillator.com/learning_center/weekly_chart/deserved_or_not_t-bonds_are_set_up_for_a_rally/
Don't know why this didn't show up here the first time I posted it, but congratulations on a profitable day!
ReplyDeleteIf anyone want's my opinion, when charts are generally behaving the Elliott Wave pattern is arguably the single most useful chart pattern ever observed in all the history of chart patterns. When they're not behaving, it probably doesn't actually help anyone that the Elliott Wave principle comes with enough exceptions to rules and fuzzy guidelines that a determined person could probably monkey wrench a child's drawing of a cat on any refrigerator door in America into a valid wave count. There I said it.
ReplyDeleteThere's a heavy dose of "art" in it. When you first start trying to understand it, though, it's a lot of "huh?" It's definitely not "paint by numbers" TA.
ReplyDeleteAnd no TA has 100% clarity 100% of the time -- or even 70% of the time. Pretty sure there's not a single technical analyst who really "knows" what's going to happen next. There are guesses, there are probabilities, but there's no crystal clarity for anything at times like this.
You'd think a professional writer would know how to... you know... write... I was mystified for most of the time at wtf he was trying to get at.
ReplyDeleteCongratulations on your profits!
ReplyDeletelmao
ReplyDeleteEUR/USD just entered the free-fall zone, if they can't reverse it immediately...
ReplyDeleteAnd looks like futures gave up the ground they had earlier. I halved my puts this morning - perhaps a little soon. I'm skittish about this right now... plenty of support below: long term trend line, 50day ema... I can't help but think bears are about to get sucked into a trap...
ReplyDeleteGood morning PL, I was pleased to see the EuroDollar comment as I was looking at it myself last night oddly enough. There is (I think) a nice wedge forming which converges at 90 days. 60 days is 10th of May so maybe that will be the drop zone? And if so, does that have any meaning for the markets? On the other hand the NDX chart, although on too short a time scale, is 100% bearish. It is a hint, no more, of an approaching trend change. What d'you think? Kind regards
ReplyDeleteDollar's formed a pretty nice looking a-b-c off the highs -- I think if dollar bulls can reclaim the down-trend line, then it's headed for new highs.
ReplyDeleteAnd I'm still favoring the more bearish count on equities.
Don't worry about it SG1. EWT is a chameleon and frequently morphs into other structures, very often it isn't until the last line of the last wave is in that you can feel fairly sure about things. That's why PL keeps emphasising- wait for the confirmation. eg a 5th wave might look 'in', then throw in another subwave, then another. Metals are particularly prone to this behaviour. Keep at it, stay on site with PL, you'll crack it no problem. ;) Kind regards
ReplyDeleteHi NJ268, I've heard of the MO, seems very useful in experienced hands. I've got used to the Stoch Mom Indic because when it exceeds 80 I'm ready to trade, sometimes it gets to 90+ when it's 'fill your boots' time! I found trading in the middle wipes one out so only ever trade in meaningful quantities at extremes. That way I sleep at night. EWT identifies those extremes very well and when they coincide... pile in. Yep agree could well be a good surge but a new top?... mmm... not so sure. Thing is, SPX would take at least 4 weeks to reach 1440 and I don't think there is that much time left. Could be wrong of course but low probability. NDX climbed faster at 0.4%/day so it would need about a week to a new top, but COMP looks as if it has topped with a truncated 5th (have a look) so not looking good for new tops. IMHO. Here's NDX ichi moku chart, looks bad for bulls.
ReplyDeletePL and team, I need some help. I am looking for free historical futures quotes (ES, NQ100 and R2K) covering the past few years for backtesting purposes. Some sites make available their daily bar database, but I am looking for more granularity - 120 min bars ideal, but the more granular (e.g. down to 1 min), the better. Would anyone know if/where I could find it? Alternatively, if some of you maintain a personal quote database, would you mind sharing? I collected quotes from some paid services, but all are expensive. Any help is welcome. Many thanks in advance!
ReplyDeleteIf it is then it may be a bottom diamond or a tilted continuation rectangle. Have to wait and see, am watching this market for signs of a bottom that should lead to a rally back to the failure point. That would be the upwardly sloping trendline, so depending on the timeframe to get back to that point it is possible to have higher highs.
ReplyDeleteES/240 ~ ES may move down -- prolly fairly quickly -- to finish up this Ewave 5. Bear flag is gettin' a bit extended for my taste tho, makes it a bit harder to predict. On this ST rise, 1385 is a must hold, above that breaks the EW5 and the run to 1368 to 71 is off. IT direction is still down but we are due for a rise, prolly to about 1394 (20 MA on the 480) to 1398 (50 M on the 480). AAPL broke above my predicted high of 636, still looking for an indicator candle on the DAY before any short position can be established. Or a break of a TL. TVIX still on the rise, NAV is not a factor in a confirmed (down) move.
ReplyDeletehttp://screencast.com/t/vLRA55R1
AAPL ~ same rules, they do not change and if you are rules based you will win; if not you are shooting in the dark.
http://screencast.com/t/nAUswe2aI
Off to work - all y'all have a great day.
ReplyDeleteUpdate's posted, let's continue discussion over there. :)
ReplyDeleteHave you tried the free quote service on my site? No clue how far they go back, but prolly worth checking.
ReplyDeleteThanks....Now I just have to do it in a way that doesn't give half of it to the broker...i.e. sticking exactly to the plan....9 trade with +11 pts -5.5 pts in commissions with the amount of trades. I'm in the wrong business..lol
ReplyDelete