"You cannot get something for nothing unless you have previously gotten nothing for something."
"TANSTAAFL: There Ain't No Such Thing As A Free Lunch."
-- Robert Heinlein, The Moon is a Harsh Mistress
In this piece, we're going to look at equities, bonds, oil, real estate, inflation, and more, and attempt to tie it all together in a sort of Unified Field Theory of Everything. I can't promise that ambitious effort will be entirely perfect, but hopefully it will at least provide food for thought.
In December, I began to speculate that the end of the 12+ year bull market was drawing near, and I've made no secret of my bearish long-term outlook in the months since. But while I've obliquely covered some fundamentals in that time, I've primarily continued using the charts as my justification. This is at least partially because the fundamentals didn't look too bad in December (more evidence that charts
lead the news), so, initially, there really wasn't much to talk about from a fundamental standpoint.
Fundamentals tend to be reported on a lag, to the point that the Fed typically doesn't recognize when a recession begins, except in hindsight. The stock market is a leading indicator, so you simply can't predict a
leading indicator by using
lagging data. You can, however, do the opposite.
Nevertheless, some folks believe charts to be mumbo jumbo (they aren't) or a form of voodoo (I can't comment on this without permission from the High Voodoo Priestess, or I risk being expelled from the... what am I saying?!? Ha ha! I meant to say: "Of COURSE chart reading isn't voodoo!"), so today I thought it might be worth taking a deeper dive into the...
fundamentals. (Insert ominous music here)
And some more charts.
Because hey, you can take the analyst out of the technical, but you can't take the technical out of the analyst. (Or whatever.)
I'm also going to provide an in-depth analysis of the real estate market and discuss why it may hold up better than equities.
Anyway, before we get into the fundamentals, I want to briefly touch on one of my historic charts for any new readers, and for the "charts are voodoo" folks.
It was years ago now that I began presenting my chart-based thesis that we were headed toward a long-term peak in equities, and below is my preferred count (Elliot Wave-speak for "favored prediction") as published in early March 2020: Note the rapid crash to ~2100 was predicted, the bottom at ~2100 was predicted, the recovery to new all-time-highs was predicted, and the completion of Cycle 5 was predicted to arrive around the beginning of 2022. All of it has since played out (though to be fair, we won't know for certain that Cycle 5 has indeed marked a major top (five waves at Cycle degree complete a larger wave at Supercycle degree) until it's in the rearview mirror).
Can fundamental analysis do all (or any) of that? Especially in a fast-moving and at times panicky market?

So here we are, in 2022 (though again, for new readers, I began suggesting that it was
time to sell the rallies back in December 2021). At that time, however, nobody was particularly bearish. Boy, that has sure changed over the past few months, as the Fed has turned uber-hawkish, inflation has skyrocketed, bonds have plummeted, and the frailties in the system have begun to bubble to the surface for all to see.
Let's look at some of the fundamental issues, starting with the 10 year yield:
The 200 MA on the chart above lines up reasonably well with the very-long-term trendline on this all-data log chart from
Worth Charting. This trend line has contained yields for 40 years. 40 financially-prosperous years for the United States, we might add, in a largely low-inflationary environment. A sustained breakout might thus signal a sea change from those conditions:
Next, the current Treasury drawdown (courtesy of
SentimenTrader):
And next, the trimmed mean inflation ratio, courtesy of Your Friends
™ at the Dallas Federal Reserve:
So all of that looks pretty sickly, wouldn't you say? This is not a great start to any sort of "soft landing." It's more like what you might expect to see at the start of a crash landing. Or just a crash.
In fact what we're seeing is the worst bond crash since 1987 and 1994:
Fund flows into bonds have been net negative, though not yet worse than 2020, 2018, and 2013.
Something that jumps out on the chart above is that fund flows into equities are still high -- it jumps out because it suggests downside potential in equities is also elevated. (Though I'm not sure how "downside... is... elevated" works out from the standpoint of the English language.)
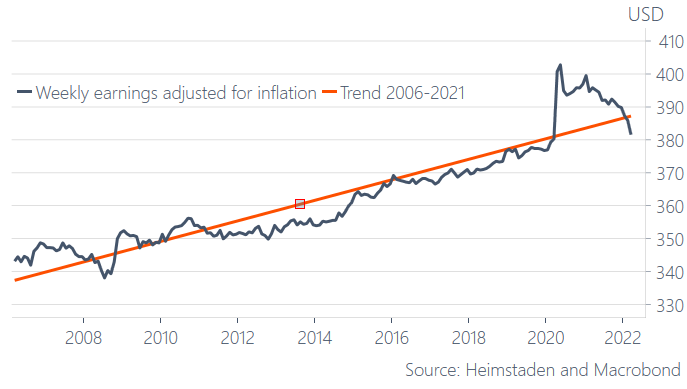
Of course, if we were The Federal Reserve, we might shrug that off and talk about how amazingly incredibly just unbelievably WOW "strong" the labor market is. Unless we looked at the next chart, which is weekly earnings adjusted for inflation. Which has fallen off a cliff. This is why all the talk of the so-called "strong economy" just isn't resonating with voters: People don't look at BLS job numbers to judge the economy, they look at their own checking accounts. And their checking accounts are shrinking fast.
(On the bright side, we probably won't be hearing anything about how we're saving 16 cents on a pack of hot dogs this coming Fourth of July, given that a pack of premium hot dogs now costs more than your average used Chevy did three years ago.)
The graph above helps explains the graph below, which is consumer sentiment. Again, despite the headline numbers, people know that something is going wrong because their own finances tell them. Consumer sentiment hasn't been this low since just after the "Great" Recession ended.
We've all seen the headlines that "inflation is the highest it's been in 40 years," but many people aren't aware that the way inflation is calculated was changed (several times, in fact), and if we use 1980 methodology, for example, inflation is even worse. The chart below comes from
ShadowStats and uses 1980 methodology to calculate current inflation (blue line). Inflation is now running near 17% if calculated on that basis:
Of course, the Federal Funds Rate was 21% back in 1981. Right now, the effective Federal Funds Rate is 0.50%. Because the Fed is Very Serious About taming inflation!
I find it almost comical that recent inflation seems to have come as a surprise to so many of the people who are put in positions of power specifically to anticipate this stuff. Killing domestic oil supply causes the price of oil to increase. And flooding the money supply via stimulus and deficit spending creates too many dollars chasing too few goods. This causes dollars to be worth less (the price of goods isn't actually increasing, the value of dollars is
decreasing), as the new dollars steal their value from the old dollars, resulting in a net-zero effect -- no wealth is created by printing money, it's just moved from old dollars to new dollars, making
all dollars, both old and new, worth less. We call such a situation "inflation."
This has been well known as a basic tenet of economics for longer than I've been alive. It's hardly rocket surgery. As I warned back in July of last year (in
Why the Fed Will Be Powerless During the Coming Supercycle Crash):
For starters, Covid, or more correctly, our government's response to Covid, has hastened our demise. The Federal Reserve and the American government's kneejerk reactions led them to "lockdown and debt-up" with abandon. This destroyed untold thousands of small businesses and buried us in record debt, so we are now left with permanent long-term problems in the wake of those short-term temporary "solutions." The only way out of this mountain of debt is for the Treasury to inflate its way out (i.e.- pay back yesterday's debt with tomorrow's dollars, which will be worth a fraction of yesterday's dollars, courtesy of inflation).
This means that, regardless of what they tell us, inflation is likely here to stay (for as long as market forces will allow, anyway) -- because it's the government's only way out, and they know it.
So why did so many people get it wrong? I suspect due to simple complacency. It wasn't too long ago that certain people we're supposed to take seriously were still entertaining MMT (Modern Monetary Theory; aka: "Magic Money Tree") as if it weren't completely ludicrous. As I wrote nearly a year ago now (May 10, 2021):
[I]nflation is picking up a pretty solid head of steam, which will be interesting, inasmuch as the Fed really hasn't had to deal with any inflation since the beginning of Quantitative Easing in 2009. It's obviously easier to print money in a deflation, since liquidity is being destroyed faster than it's being created, leaving you lots of wiggle room.[Y]ears of deflation have led naïve politicians to believe there are no consequences to money printing, so, as so often happens, the current generation is ill-prepared for what seems to be developing.
Young people often believe that "old-fashioned" wisdom is outdated, when it should instead be viewed as the collective lessons that humanity has learned through thousands of years of trial and error.
“Tradition is a set of solutions for which we have forgotten the problems. Throw away the solution and you get the problem back. Sometimes the problem has mutated or disappeared. Often it is still there as strong as it ever was.” ― Donald Kingsbury
As we've discussed on many previous occasions, bull markets breed complacency and carelessness, and those attitudes are always a recipe for trouble.
The bottom line is, despite the Fed's talk of 2022 having "the strongest labor market in forever oh-my-gosh-just-wow," things are already worse than many headlines suggest. And most people know it, on some level. And the thing is, the Fed rate increases haven't really even started yet, nor has the Fed attempted to taper Quantitative Easing. What we're seeing now seems to be simply what happens when the Fed stops buying Treasuries via QE and the market is allowed a taste of true price discovery.
In other words, this is only the beginning, the first ripple in the pond.
Oil
When the Fed says they need to control inflation, in one sense, what they're really saying is that they need to bring down the price of oil. At face value, oil prices impact the cost of shipping, which bleeds over into everything that has to get from one place to another (in other words: everything), including most of our food. And of course, it impacts the cost of electricity, which again impacts the cost of everything, including the refrigeration needed to preserve our food.
But a level deeper, we find that oil is a key component of plastic, which is found in everything from computers to food packaging to the bristles on our toothbrushes to the acrylic in our house paint to the nylon in our shoes and clothing. Oil is also a key component of many pharmaceuticals, of the ink in our pens, and of literally thousands of other hard goods that have nothing to do with fuel.
A massive portion of the economy requires oil in order to function, both literally and figuratively. When the price of oil rises, then the price of virtually everything must rise with it.
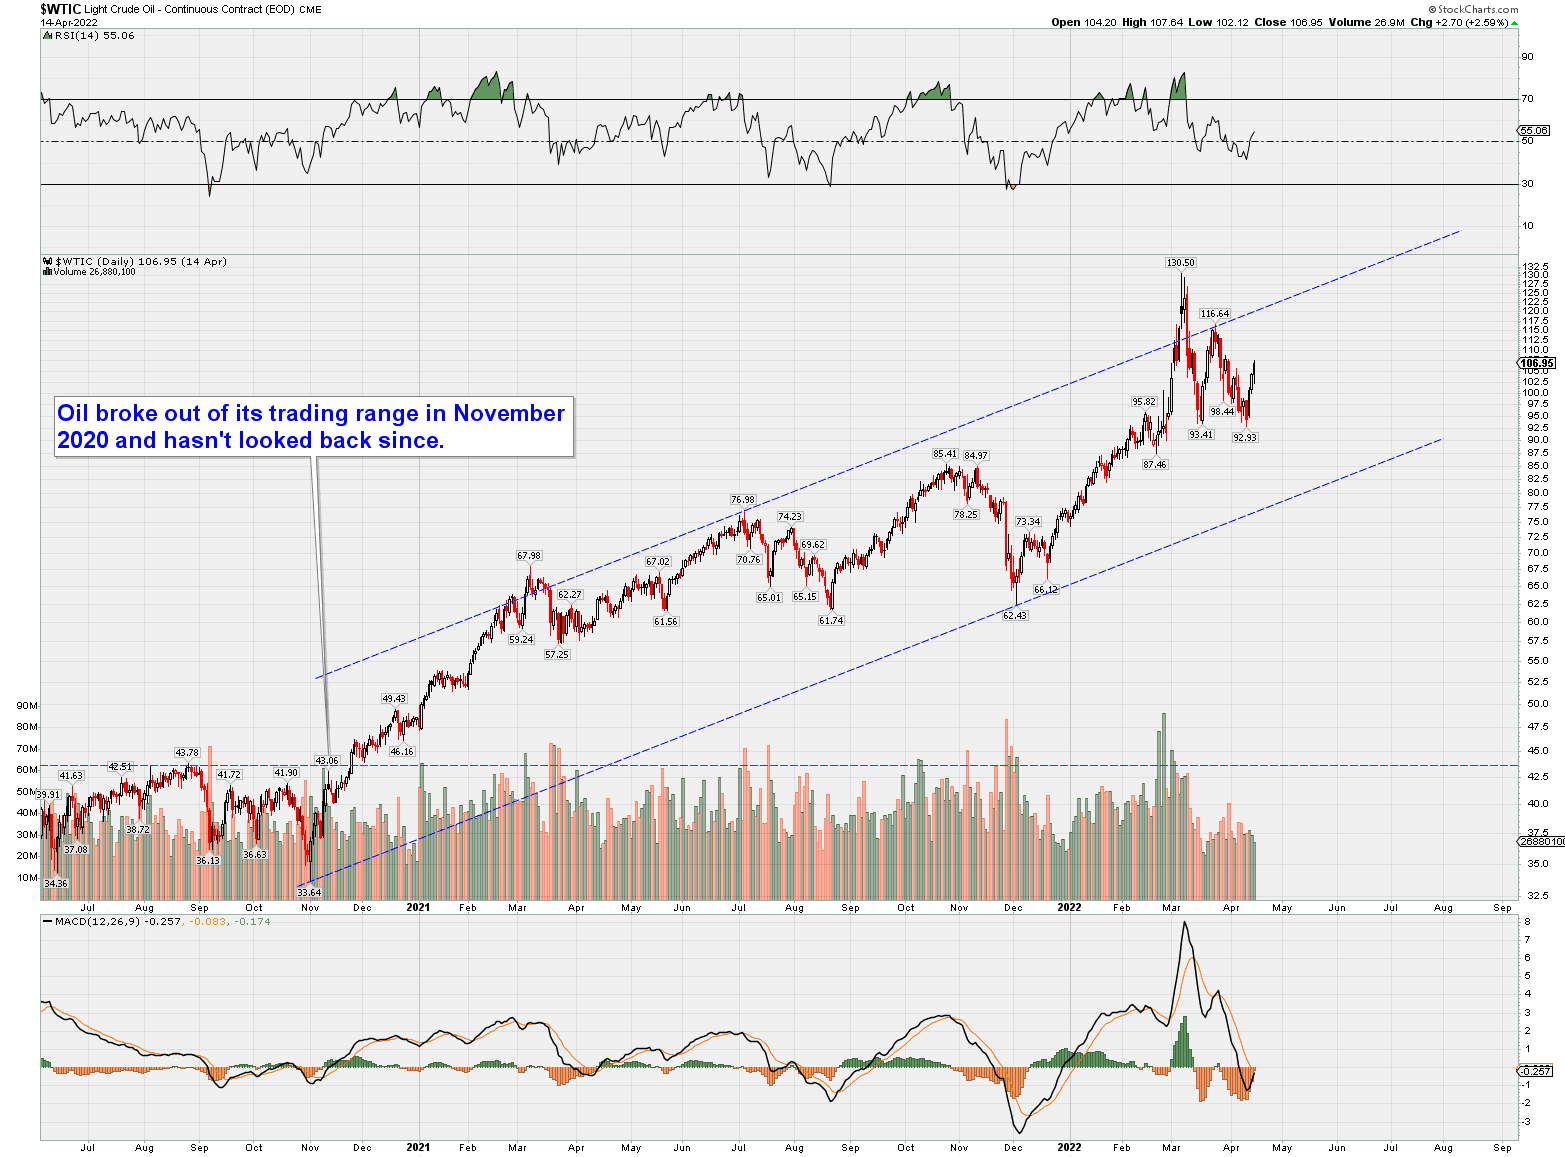
As we see on the chart above, oil broke above its prior trading range just after the 2020 election and hasn't looked back. The market always anticipates the future; that timing is not coincidental.
One problem here is that while destroying domestic oil supply can be done in seconds by a politician with a pen, increasing the supply of oil takes years, and most people do not realize how involved it is. Federal permits alone take 140 days. A land or ocean survey takes up to two years (sometimes longer), and that's before even exploratory drilling can commence. From there, it takes an average of 5.5 years to bring any oil to market -- and it takes an average of 17 years for an oil field to reach full production.
"As a matter of cosmic history, it has always been easier to destroy than to create."
-- Mr. Spock, in Star Trek II (TOS)
But what we're witnessing today goes beyond simple logistics. The Wall Street Journal lays out some of the major hurdles facing domestic oil producers in even more detail, in a piece titled
Biden's U.S. Oil Embargo, quoted in part below:
The Administration has halted onshore lease sales. Producers are developing leases more slowly since they don’t know when more will be available. Offshore leases were snapped up at a November auction because companies expect it might be the last one. Interior’s five-year leasing program for the Gulf of Mexico expires in June. Yet the Administration hasn’t promulgated a new plan.
Then there’s the not-small problem of financing. Companies can’t explore and drill, or build pipelines, without capital. Biden financial regulators allied with progressive investors are working to cut it off. The Labor Department has proposed a rule that would require 401(k) managers to consider the climate impact of their investment holdings.
The Securities and Exchange Commission is expected to issue a rule requiring companies and their financiers to disclose greenhouse gas emissions. Mr. Biden has nominated Sarah Bloom Raskin, of all people, to be the Federal Reserve’s top bank supervisor. Her top priority is using bank regulation to redirect capital from fossil fuels to green energy.
Large energy producers are buying back stock and redirecting capital to renewables because they see the Administration’s writing on the wall. Small independent producers are eager to take advantage of higher prices but can’t get loans. Many relied on private equity during the last shale boom, but now these firms are cutting them off.
Progressive outfit Global Energy Monitor gleefully proclaimed Tuesday that $244 billion in U.S. liquefied natural gas projects are stalled because they “are struggling to find financiers and buyers” amid “pressure from cheap renewables"—i.e., rich green energy subsidies that Democrats want to make richer—and “tightening climate commitments.”
It’s almost a miracle that any oil and gas production is occurring in America amid this political hostility. The Ukraine crisis ought to be an inflection point that causes the Biden Administration to do an energy reset. Instead, the President says it “should motivate us to accelerate the transition to clean energy” and reduce our dependence on fossil fuels.
Mr. Biden bemoans today’s skyrocketing gas prices, yet he remains hostage to the green-energy donors whose policies guarantee higher prices. The President is enabling Vladimir Putin’s energy leverage even as he claims the opposite.
And it is by this road that it has now fallen to the Federal Reserve to attempt to bring down the price of oil, and thus to quell inflation, by tightening monetary policy. This is the wrong tool for the job, akin to using a hammer to fix a leak. You might be able to pound the leak closed, but you're going to do a great deal of collateral damage in the process.
In the end, all of this self-inflicted pain may well crash the entire economy, bringing with it a widespread pain an order of magnitude worse. Which would, ironically, almost certainly bring down the price of oil. At which point: "Mission accomplished," I suppose.
Speaking of, let's talk about the stock market.
Stock Market
Most readers know that the Fed has been engaged in Quantitative Easing since 2009, and that inflation has now forced them to end that. Here's the Fed's balance sheet, which is currently sitting near $9 trillion -- that's $9 trillion pumped directly into the market, with $5 trillion of that coming just since 2020:
Quantitative Easing is ostensibly not "for stocks," it's for Treasuries and Mortgage Backed Securities -- but a lot of that money has found its way into equities.
And now it's ending.
Eventually the Fed even promises to reverse it. In the past, I might have wryly mused that they'd fire up the QE printing press at the first sign of trouble because in the past they would have, but as I outlined in
Why the Fed Will Be Powerless During the Coming Supercycle Crash (which I will quote below), they will no longer have that luxury. The forces of chaos are at the door, and the Fed cannot pump QE without driving oil (and thus inflation) into the stratosphere.
The unpleasant truth is: No matter what the Fed does, markets cannot maintain a trajectory of permanent bullishness, because there are forces acting upon reality that are far more powerful than the Fed.
The advance of civilization is not linear -- it is nonlinear and often asymmetrical. And while it may appear to have "advanced without ceasing" (at least in terms of technology) from the limited perspective of our brief lifetimes, we know from history that civilizations do not rise endlessly. They rise for a time, then they contract for a time (this occurred in America as recently as the Great Depression).
Then they may rise again -- or they may fall entirely.
But either way, they do not advance without ceasing in a steady upwards march. In part because of outside forces, and in part because of internal forces (outlined in broad strokes herein):
- Good times create excesses in the economy, which breeds complacency and arrogance in our leaders
- Complacency and arrogance lead to short-sighted policies that will, unavoidably, ultimately precipitate bad times
- Bad times turn old excesses into scarcity and lack, which creates a new mindset of prudence and conscientiousness in our leaders
- After the old slate has been wiped, prudence and conscientiousness then lead to new growth
And the whole cycle repeats
[We've been in stage 2 of this cycle for a while now, as I'll outline directly.]
Stage 2 of the cycle: Complacency and arrogance lead to short-sighted policies that will, unavoidably, ultimately precipitate bad times. See previous discussion on the self-inflicted oil crisis, which is now precipitating the monetary crisis, which is in turn precipitating the bond crisis, all of which will soon precipitate the stock crisis, which will then precipitate an economic crisis.
We are destroying ourselves in a blind fit of misdirected "do-gooder" rage, while blaming "
the Existential Crisis that isn't" and "Putin" and [
insert anything other than "ourselves" here]. "We must destroy ourselves to save ourselves" seems to be the paradoxical mantra of our leaders, and that this attitude has gone mainstream has been apparent for some time.
Ideas have consequences.
As I also wrote in that same piece:
So we've built a massive asset bubble on top of a mountain of debt on top of the ever-shifting sands of normal existence.
And, in the process, we have left ourselves virtually defenseless against any future problems. We have left ourselves completely exposed to both the whims of fate and the folly of our fellow man.
We've built a house out of eggshells in the middle of an earthquake zone.
The next crash will take this entire fragile construct down in a fashion that exposes and exploits each and every weakness in the system, known or unknown. Problems that were papered-over on the way up will compound themselves on the way down, as the entire destructive frenzy feeds upon itself cannabalistically, until it has finally devoured all the excesses we've poured into it. And more.
Alas, there is nothing the Fed can do to stop this once it begins in earnest. The Fed likes to talk about its "tools," but all its tools are currently running at full capacity just to keep the market from collapsing under its own weight. There are no more tools to call upon.
All it will take is a catalyst.
Later, people will blame the catalyst as if it were the "cause" (you and I know they will do this because they do it every time) -- but we'll know it was not the cause. Our short-sighted choices were the cause. Our inability to recognize, appreciate, and properly manage our good-fortune was the cause.
In short, we ourselves were the cause. We have met the enemy, and he is us.
The catalyst will only be the trigger that forces the reckoning.
The first catalysts have arrived. And our response so far has been to compound our errors.
I'm bearish because of what I see in the charts, but I'm also bearish because of what I have seen developing in our nation itself, and in our leaders. This has been a long time coming.
Our country was founded on solid principles. Those principles led to our success. They predated it; they created it. As we grew in stature, we began to forget the underlying principles, but we continued to live in the systems those principles created, so we continued to grow stronger: We were embodying the core principles, whether we understood them or not.
But over generations, we've drifted further and further from those principles. Few in the modern world seem to even understand those principles -- and we certainly won't value what we don't understand. And... some are actively rooting for destruction though they do not and cannot realize that's what they're rooting for; they bear destruction in the name of "progress" (because they truly believe in what they're doing).
We have, in essence, discarded the very principles that brought us success in the first place.
Since we, as a nation, are (as with all entities) merely the sum total of our ideas, this deterioration of our core principles cannot and will not continue without consequence.
This, I suspect, is the last thing we see as a Supercycle Peak approaches.
Bottom line: In my estimation, between the Fed's long-term juicing of the market, the deterioration of both logic and ethics in the general populace, the unwillingness of our leaders to value their people more than they value controlling them through fear -- among other things -- we have brought this upon ourselves. And will continue to do so, because we have become both addicted to, and trapped by, our own hubris.
Have you ever seen someone engage in self-sabotaging behavior? We're presently witnessing an entire nation engaged in such behavior. And we are unlikely to course-correct, since we seem unwilling or unable to accurately diagnose the problem. Perhaps the silver lining is: Sometimes the only thing that can save someone from themselves is to hit bottom.
Let's look at a chart that draws on past fractals to speculate one generalized roadmap of how this might go. The beauty of real-time analysis is that we really don't need to see 5 years into the future, we just need to know the basic idea right now. For example, if we crashed down toward 3000, I would hope to identify any inflection zones as they arrived, and, if need be, we can reanalyze based on the pattern as it sits then.
On a shorter time frame, the zone where I would reconsider the thesis that the Supercycle peak has arrived remains near the upper black trend line:
On the very short time frames, nothing has changed in any material fashion from
Wednesday's update, so I'm not going to rehash that here.
Finally, "and now for something completely different": I do have a piece of potentially positive news, so we can end this on a high note (if that's possible).
Real Estate
I don't usually cover real estate, but it's a hot topic these days, and I've seen a lot of people predicting a real estate crash. Presumably this is because folks remember 2006-2011, when real estate and equities crashed in close proximity to each other; and because it seems natural to assume higher mortgage rates mean housing prices will have to come down (for payments to remain equal); and because the Case-Shiller Index is higher now than it was before the last crash, and because, once again, we have a Fed that helped overheat the real estate market. So at a base level of analysis "all that must mean housing is in another bubble and ready to crash."
Well... I don't think it's that simple. First off, we have to remember that the real estate crash that began near 2006 was part of what led to the Great Recession and the subsequent stock market crash. During most recessions, real estate holds up fairly well. From 1970 to 1980, for example, housing prices more than doubled, thanks in part to the tailwind of high inflation. During the 2000-2002 equities bear market and dot.com bubble burst, real estate likewise continued rising. It pays to remember that the 2008 stock market crash didn't "cause" real estate to crash -- real estate was already crashing.
The last housing bubble was significantly different than the current housing market in some key ways, which I'll attempt to outline below.
For one, thanks in part to government mandates (see:
Community Reinvestment Act, etc), lending standards had become incredibly lax heading into the prior crash. Government intervention essentially forced lenders to issue loans that wouldn't have flown at most other points in history, including today. Nearly 40% of all mortgage loans pre-crash were subprime/Alt-A. And anyone remember NINJA loans? NINJA stood for "No Income No Job No Assets" (even though that's technically "NINJNA"). Point is: In 2006, there were a lot of unqualified (by historical standards) buyers living large in their McMansions. That is not the case today.
Same goes for adjustable-rate mortgages. More than 50% of mortgages in 2005 were ARMs, while they've made up only between 8-18% of mortgages in the years since the bubble burst. When rates are near historic lows, there's little incentive to get in via ARM. In fact, borrowers who bought or refinanced in 2020-21 are sitting especially pretty right now, with loans that will become easier and easier to service as inflation outpaces their mortgage rates.
As further evidence, check out the chart below, which is self-explanatory:
Mortgage debt service payments as a percentage of disposable income are now near the lowest levels they've been in 40-years, and about half of what they were at the peak of the 2006 real estate bubble. That alone suggests that the current housing market is not like 2006.
The next chart is also interesting. The Case-Shiller Index is well known, and people who look at the CSI with no further analysis might conclude we're in another bubble, because that Index has reached new all-time-highs. But as I'm outlining, analysis of complex markets often requires a multivariate approach; the chart below adjusts Case-Shiller for both inflation and mortgage rates, and thus paints a much less alarming picture than the raw CSI data:
Housing supply is another difference, with current inventory being roughly one-third to one-half what it was in 2006.
And yet another difference between the housing bubble and today is that, for the most part, housing today is being bought by families (and investors), not by pure speculators hoping to "flip" a house for "massive gains" via a strategy they learned about in the course of one late-night infomercial. This means that as the music stops and mortgage rates rise, we have a much different dynamic in play this time. Rising rates do, of course, have an impact on future affordability -- but they have no impact on families already in a home (presuming these families have a fixed-rate mortgage, which, as we already covered, the vast majority do). If anything, rising rates might tend to inspire people to hang on to their homes longer instead of putting them up for sale, which would have a tightening effect on inventory. After all, if you're in a mortgage at ~3%, what possible incentive do you have to ever exit that loan with inflation running above or near 8%?
As I mentioned earlier, inflation should provide a tailwind for housing -- in more ways than one. If my reasoning above is in the right ballpark, then rising rates may, perhaps counterintuitively, provide impetus for inventory to ultimately balance. Houses might spend more days on market due to fewer buyers, but if fewer homes are being brought to market in the first place because families are incentivized to stay put (or to turn their old 3% mortgage home into a long-term rental), those seemingly-opposed forces could tend to counteract each other.
Rents are another factor that impacts housing values. Rental rates are "sticky" since many leases are 6 months to a year (or longer) -- but as rents are being renewed, we're seeing current rental rates rise, with a 17% YoY jump in February. This, again, is a difference between the bubble and today; in 2005, rents were markedly lower than mortgages in many markets, making renting the more attractive option.
An X-factor that differentiates the current market from past markets is that many jobs are now allowing remote work, especially post-pandemic. This alone motivates people to have a place to call their own, and, in my opinion, will help drive an exodus from some of the big metro markets. Thus, I wouldn't be surprised to see housing prices ultimately start falling in certain local markets (housing is, in the end, always "local") -- but I'm going to go out on a limb here and state that I suspect overall, real estate will hold up fairly well for the foreseeable future.
Bottom line: It wouldn't surprise me if prices level off somewhat as mortgage rates rise, with potentially some corrections along the way, but I don't believe we're in a bona fide housing bubble the way we were 15 years ago, so I don't believe we'll see a real estate "crash" from current valuations.
So as of December, I'm a major equities bear, but I think real estate will not suffer the same fate yet (this analysis of real estate is not intended as a super-long-term prognostication, only "the foreseeable future" as things will likely change somewhere down the road, of course. For example, if unemployment hits 26% in 2025, obviously that would become a new input in the equation).
But, in the end, as I've said on our forums: I'm so bearish on equities (and the implications that might have for the broader economy) that I end up coming full circle to where, in regards to my family home, anyway, I just don't care if real estate goes up or down -- in the sense that I personally would not want to be renting if things get as bad as I suspect they might.
On the bright side, Supercycles do typically take some time to unfold completely, sometimes a decade or longer. For example, in 2011, I predicted oil's Supercycle decline would eventually take it all the way down to 25, and it then took
9 years for that target to be reached. Even if we have indeed already seen the peak of equities and our economy, we may get a crash and a recovery within the Supercycle bear -- essentially a cyclical bull market within the secular bear market -- before the BIG third wave down wipes out everything.
Or maybe I'm way off and everything will suddenly turn around; I have three kids, so I'd rather it did. This is one of the rare occasions when I genuinely hope I'm wrong. Trade safe.


No comments:
Post a Comment