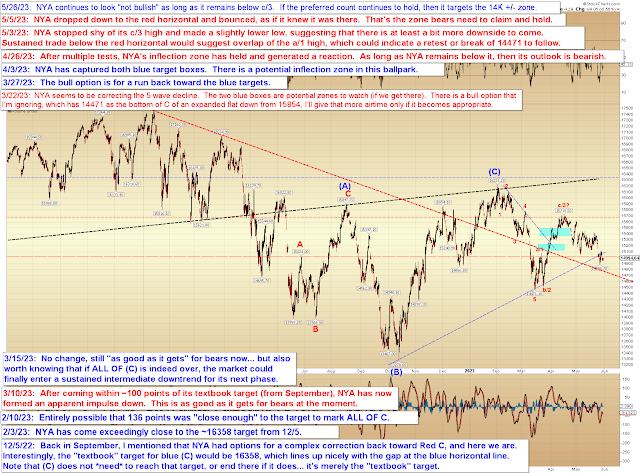
Let's start off with a look at NYA, which continues to lag severely:
Next, a reminder of my current near-term view, which is unchanged since last week:
This lag suggests two diametrically opposed possibilities: Either SPX only has a little more upside, and the rest of the market will drag it back down -- or SPX is headed toward at least Red 2 and that will drag the rest of the market up. NYA may become particularly germane here -- IF it can break above the red c/3 high, as it would then need to go on to form 5 waves from the 15055 low. Right now, because of the divergences across markets, it's a bit early to determine how significant SPX's breakout may or may not be, so how these markets collectively behave during the upcoming sessions will be important toward drawing firmer conclusions one way or the other about the larger time frames.
Next up, there is potential intermediate resistance overhead in SPX on two different scales, the first of which is shown below:
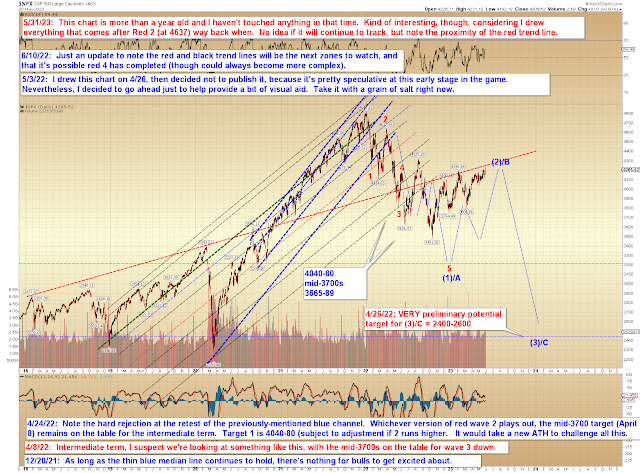
Long-term resistance shows on the next chart as well -- which also happens to be a crazy projection chart I drew more than a year ago. I haven't moved anything on this chart since then:
In conclusion, NYA continues to want to try to pull SPX down. SPX is also facing overhead resistance, which just happens to roughly line up with a chart I drew before the bear market was even being called a "bear market" by the masses. So, it will be interesting to see if we're getting into the ballpark of a turn, or not. Trade safe.


No comments:
Post a Comment