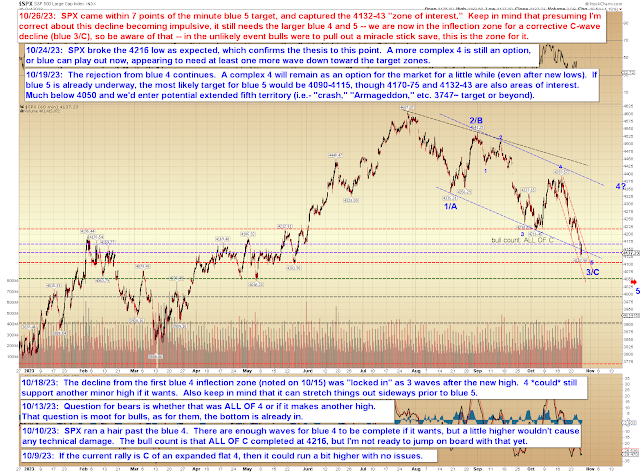
Returning to my bear bias at the moment: Keep in mind that we cannot yet rule out a fifth wave extension -- so this is a little bit tricky, in the sense that we're into "bounce or break" territory. A normal fifth could bounce soon, where an extended fifth will waterfall. My approach at such times is to pay closer attention to near-term trend channels and at least keep a few runners short until such time as the market breaks out of its crash channel. The red channel on the chart above is an example of a crash channel. This approach doesn't guarantee anything, but it does at least sometimes keep one from missing any sudden "whooshes" lower. None of this is trading advice, of course.
The reason I mention runners (as opposed to stubbornly refusing to take any profits at all) is because most of the time, fifth waves end in the ballpark of where they're "supposed" to.
Next up, let's look at a TRAN chart I drew exactly one year and 8 months ago, published in a piece titled As in December, I Remain "Long-Term Bearish Until Proven Otherwise":
We can see in the updated chart (below) that 2/B moved a hair faster than originally drawn, but the price placement of 1/A and 2/B were both pretty decent -- especially considering that insisting the market was entering a long-term bear market back in February 2022 was widely considered ridiculous at the time:
When we look at TRAN's chart above, it doesn't take a master's degree in Elliott Wave to recognize what appears to be a pretty clear 3-wave rally. Could it be something weird, such as an expanded flat? Sure. But that's fairly unlikely. It's more likely to be exactly what it appears to be, and that bodes really poorly for the broader market, because TRAN is a leading indicator for both the stock market and the economy. TRAN companies are involved in the business of moving goods and people around the country and around the world -- and an economy moving fewer and fewer goods/people is an economy in contraction.
This is true regardless of what the "spreadsheet economy" guys keep saying. (You know the ones I mean. They love to say things such as, "Why are people so depressed about the economy? GDP was GREAT and unemployment was GREAT and yada yada!" These folks are apparently so far removed from the real world that they think everyone exists only inside their spreadsheets as an easily-comprehended digit, so they can't understand why actual humans who are struggling to feed their families might feel differently.)
Next is a quick update to a very-long-term SPX chart:
Finally, COMPQ seems to echo the "bounce or break" theme of the fifth wave (or potential extension thereof):
In conclusion, nothing has changed from the past few weeks of updates, but we are finally in the ballpark of where a smaller fifth wave could complete and trigger a decent bounce (which, given that it's expected to be a larger fourth wave, could turn into a sideways grind that burns some time). In the event bulls can't muster a bigger bounce here (meaning the approaching target zones), we could fall directly into a fifth wave extension, do not pass Go, do not collect $22,867. (Inflation.) Trade safe.


No comments:
Post a Comment