On Friday, the market continued rallying. Several members of the forum pointed out that this triggered a Zweig Breadth Thrust Indicator, which is a rare signal that's triggered when the market thrusts its breath so forcefully that it wheezes, which makes a noise that sounds like "Zweeeeeig!" That wheeze is a buy signal. (Or something like that.)
Investopedia defines it slightly differently, stating:
"The Zweig Breadth Thrust Indicator is a calculation that measures the swiftness of market sentiment shifts. It was developed by American stock investor and financial analyst Martin Zweig. The calculation is based on the ratio of advancing stocks to the total number of stocks. It is calculated by dividing the 10-day moving average of the number of advancing stocks by the total number of stocks. The indicator is used to identify major shifts in the primary trend."
Of note, that piece wasn't written over the weekend, but was published April 12, the last time the market triggered this exact same buy signal. Which was of course in the wake of the "Banking Crisis Averted! (for now)" action from the Fed, which suggests the signal can be triggered by short-covering rallies that shift sentiment.
As I noted on the forum, one thing worth noting is that the forward P/E ratio of the SPX is currently 18.62, which isn't exactly low, and which suggests that if the market were to turn into a new bull from here, that would not be based on fundamentals, but would instead be a new bubble. Which isn't unheard of, obviously, we've had plenty of bubbles in the past -- but which may be a stumbling block for the Zweig Breadth Thrust Indicator, as the only other time it triggered with the forward P/E ratio this high was -- you guessed it -- back in April of this year.
So, maybe it's a good signal and we'll be marveling at it a few months from now -- but unlike many of the previous successful signals throughout history, this one seems to lack fundamental support.
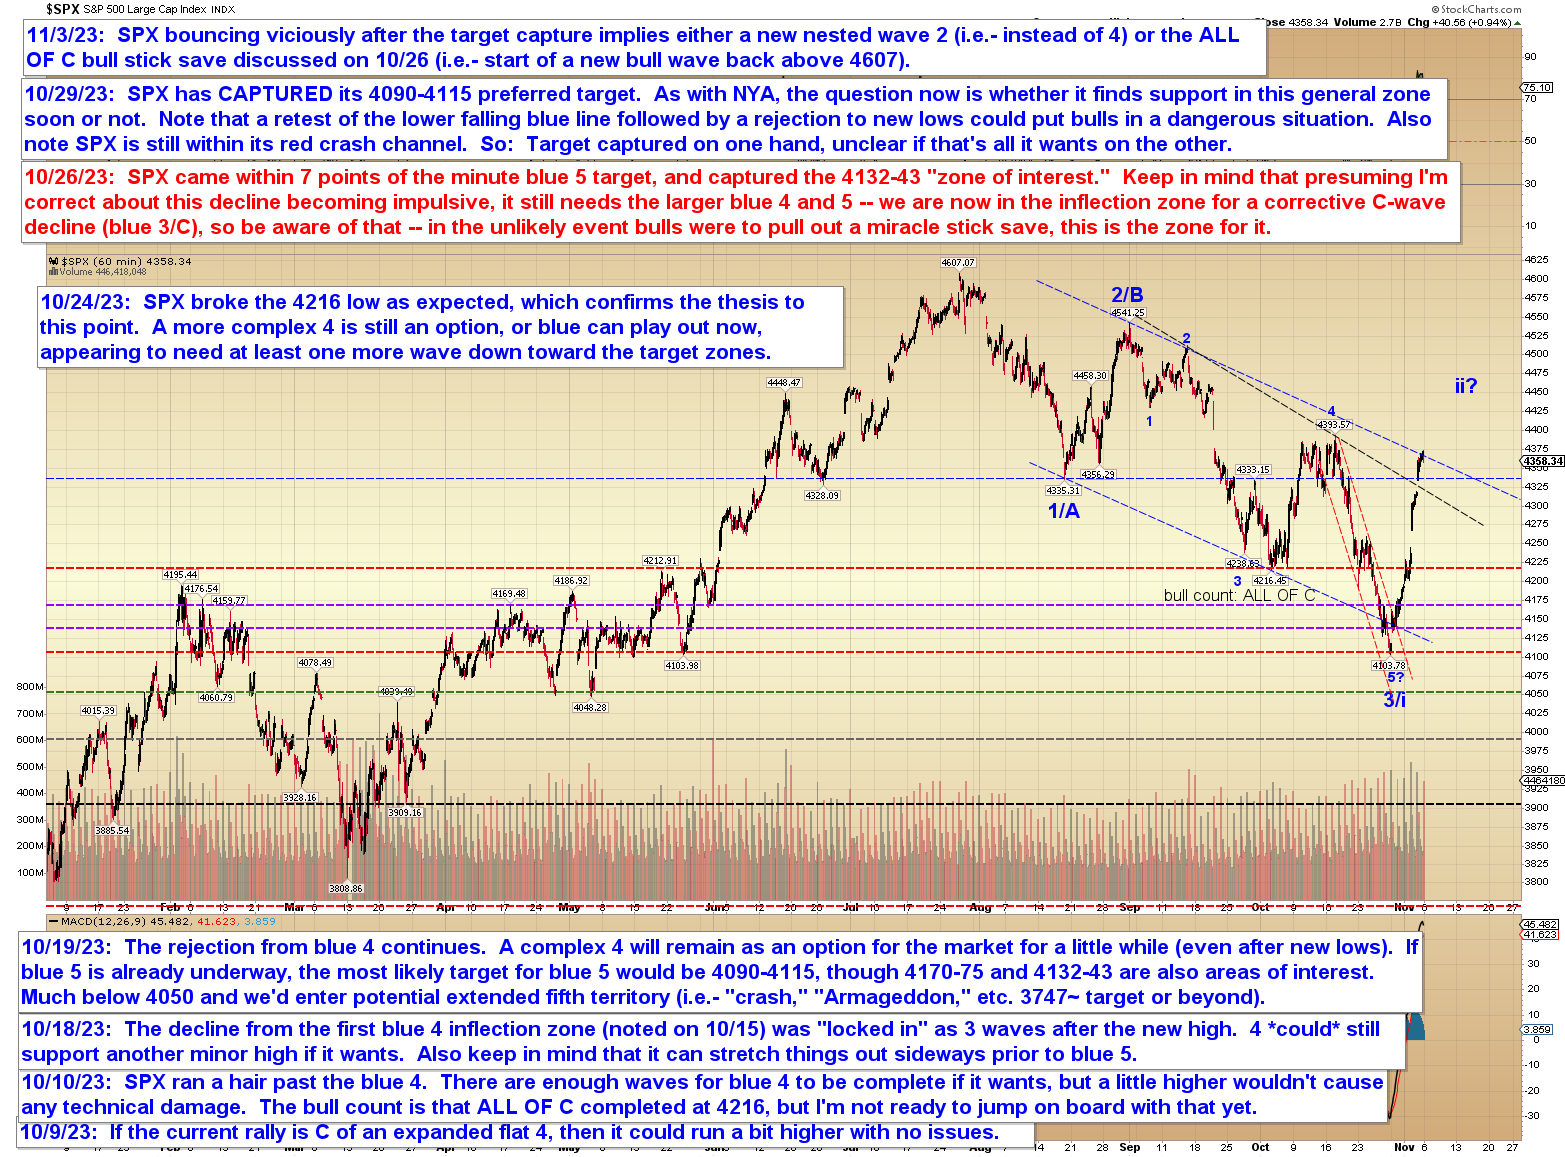
Anyway, just one chart today, where I updated the labeling to match the annotation from the prior update. Note that SPX hit the blue resistance line on Friday, so that's its next hurdle.
Not much to add beyond that. Trade safe.
No comments:
Post a Comment