Amazon

Showing posts sorted by date for query time to sell the bounces. Sort by relevance Show all posts

Monday, January 31, 2022

INDU, COMPQ, SPX, and a Whole Bunch of Interesting Data

The near term charts remain messy, so we're going to continue focusing on the longer-term chart pictures.

Before that, though, I'd like to share some interesting data I've gathered from various sources over the past week, starting with this (below).  Almost half of the members of SPX, and 76% of COMPQ, have already experienced drawdown equal to or greater than 20%.  Almost half of the NASDAQ has declined 50% (or more) from its 52 week highs:


Next, retail investors have remained net buyers during the drop (this can be something of a contrarian indicator, since retail investors aren't considered "smart money"):


Next, a chart showing that the Federal Reserve's holdings of "Trashuries" is now almost a third of the total market:


Finally, company earnings guidance has turned negative for the first time since April 2020:


Let's move on to the long-term charts, starting with a "legacy" chart of INDU:


Below is another legacy chart, this one of COMPQ, which, unlike INDU, has already tagged its noted trend line:


SPX very-long-term trend line (again) below.  Are you sensing a theme here...?


Finally, the SPX chart that proved incredibly accurate at foreseeing the recent top:


Near-term, one possibility is that SPX is forming a fourth wave triangle.  I posted the chart below to the forum during the session on Friday.  This count is speculative at the moment, not a "prediction" yet, and would be ruled out if SPX sustains trade over 4453 (which, if it happens, could take SPX toward 4525 or beyond):


In conclusion, as we've seen across markets, there is support at (and a bit below, in one case) the recent lows in the form of long-term trendlines.  As long as bulls can hold those, then they at least keep hope alive for a continued bounce, and even for a last trip to overhead resistance (though I wouldn't hold my breath waiting for that; easy to get caught looking in a market like this) -- but in either case, as I preached throughout December, I believe this remains a "sell the bounces" market.  Trade safe.

Friday, January 28, 2022

SPX Update: Other Than That

The market has remained stuck in a trading range since January 24, so there's little to add to the past few updates, except to note that I have examined some additional markets since then, and so I'll reiterate that I think any sustained new low will put the odds increasingly in bears' favor.  Meaning if that condition is met, it will become increasingly likely that the bull market we've been in since 2009 has truly ended.

Other than that, not much to add.  ("Other than that, Mrs. Lincoln, how was the play?")

Although I should mention that I noted in the forum during the session yesterday that, near-term, I suspect yesterday's low in SPX is a b-wave, meaning the market should break that low.


Note that SPX has, so far, been unable to sustain trade back above black (cue AC/DC):


In conclusion, while I spent most of December warning that it was "Time to Sell the Rallies," to reiterate: if SPX/ES sustain a break of this month's low, odds will increase that a true bear market has finally begun.  Here, I'd like to quote a bit from one December update:

Now, here's the "market point": The Covid crash was a pretty clear fourth wave. That means we have almost-certainly been riding out the fifth wave ever since. And the fifth wave is the final wave of a move -- which, now that we're finally getting into a potentially-complete wave structure, means we're likely approaching the end of the 12+ year bull market. 

What we're currently trying to nail down is whether the fifth wave of the fifth wave of that larger fifth wave has completed or not. 

Read that again. 

As I mentioned last update: 

Even if SPX manages to make a new high, that will probably be the fifth wave, and (barring an extension) is thus reasonably likely to be followed by a correction (or worse) anyway. 

In other words, even if SPX manages to make a new all-time high, we are probably into territory where we should be considering selling the bounces. Let's look at the near-term chart first, with the emphasis that "bull 5," even if it shows up, could very well be the final high of this 12+ year bull market.

Trade safe.

Wednesday, December 1, 2021

SPX and NYA: Is It Time to Sell the Rallies?

Calling tops has always been a difficult endeavor in market analysis, and considering that for the past 12+ years we've been in a historic bull market driven by unprecedented Fed intervention, it's that much harder now.  While I may have jumped the gun just a little very recently, some people (or maybe it's just one person) seem to have forgotten that -- to cite only one example -- in 2020, I believed we would crash, but also believed that was "only" a large fourth wave, and thus destined to recover to new all-time highs.  I mention this mainly because a certain troll recently claimed "this analyst has been saying the same thing for a decade" (implying that I'd been bearish for a decade), which is so wrong that it drifts into the realm of outright stupidity.

(I won't even go into my call for a long-term and massive bull market back in January 2013 -- most veteran readers know that I've been on the right side of this market more often than not.) 

Anyway, in a moment, there's a market-relevant point that I'm going to make about the following charts -- but first, here's the INDU chart I published on February 26 of 2020.  Note the (4) label and the line headed back up to new all-time highs from there:


Here's the SPX chart I published in March of 2020; again, note 4 is followed by new highs in 5:


Now, here's the "market point":  The Covid crash was a pretty clear fourth wave.  That means we have almost-certainly been riding out the fifth wave ever since.  

And the fifth wave is the final wave of a move -- which, now that we're finally getting into a potentially-complete wave structure, means we're likely approaching the end of the 12+ year bull market.

What we're currently trying to nail down is whether the fifth wave of the fifth wave of that larger fifth wave has completed or not.

Read that again.

As I mentioned last update:

Even if SPX manages to make a new high, that will probably be the fifth wave, and (barring an extension) is thus reasonably likely to be followed by a correction (or worse) anyway.

In other words, even if SPX manages to make a new all-time high, we are probably into territory where we should be considering selling the bounces.

Let's look at the near-term chart first, with the emphasis that "bull 5," even if it shows up, could very well be the final high of this 12+ year bull market.


Of course, if that final fifth doesn't show up, then we might have already seen the all-time-historic-high.

Let's look at the old intermediate term chart of NYA next.  Worth noting that NYA recently captured its 17,000+ target (published 8 months ago):


So that's the bear case, but what are the remaining bull hopes here?

Well, their first hope would be for an "extension of the extension."  The rally since 2020 has been an extended fifth wave -- bulls would like to see the (presumed current) fifth wave of that fifth wave extend.  That's always possible, but given that inflationary pressures are finally forcing the Fed's hand (per Powell yesterday), it's hard to imagine there's going to be enough fuel for that extension if the Fed follows through and indeed pulls away the punch bowl.  If they don't, then that might be another matter.

But here's the nice thing:  On the next chart, we'll look at a signal to watch that could tell us if the fifth wave of this fifth wave is going to extend.  Thus, we can reasonably presume the fifth wave is ending here if that signal does NOT materialize.


So, on the chart above, in the event SPX sustains a breakout over the upper black line, then we might forget about selling the rallies for a while and watch to see if bulls can get an even-more-extended fifth wave.  We can't yet rule that out, given that the fifth wave is short relative to wave 1 on that chart -- but nevertheless, I'm taking the approach of "making the market prove itself here," so if it doesn't break out, then we'll stick with the idea that the top is now closer than the bottom

Referring back to the NYA chart for a moment:  The second option bulls have is for a more complex fourth wave (shown by black "or 4" and "or 5"), similar to what happened in 2020, but at a much smaller scale.  We'll simply have to track that possibility as it unfolds -- but again, unless there's an extended fifth here, that potential wouldn't change the longer-term outlook too much.

Now, all that said, I would again like to emphasize that calling a top to the most powerful bull market in history is no easy task, so if you think the market is going to keep going up, then hey, you could be right.  I could be wrong, or could be early, or whatever.  Or the market could choose to extend the fifth of the fifth here, which no one can really predict.  I can't promise anything, and nothing I publish here is trading advice; I can't manage your risk for you.  That's what brokers are for.

All I know is that we just about tagged the upper boundary of the very long-term channel, we reached the long-term NYA target, we came within 6 points of the long-term SPX target, and there are roughly enough waves (give or take a couple micro waves) to mark a complete five-wave rally from the 2020 crash low.

Near-term, if bulls are going to get their fourth and fifth wave to new highs, then now may be the time.  Longer-term, until the market dictates otherwise, I'm sticking with the idea that the top is closer than the bottom, and thus that it's probably not a bad time to take some risk off the table.

Trade safe.


Tuesday, September 27, 2016

SPX Update: No Material Change


No material change since last update, except to note that, as the prior update could only speculate would happen, the decline from 2179.99 does appear reasonably impulsive at micro degree.  Although I have outlined 2180 as the "level to beat" on the chart below, as also noted in prior updates, the all-time-high is more important from a technical perspective. 

Note that 2/B could potentially be complete at yesterday's high, so any additional rally is not guaranteed.


In conclusion, there's no change from the last few updates, and I am continuing to treat bounces as sell opportunities -- please refer back to Monday's update for the intermediate charts.  Albeit this is not an "ultra-high-percentage" bear pattern (as some of them are; protect yourself accordingly), but short still appears to be the higher-odds play for the time being.  Trade safe.

Wednesday, April 2, 2014

SPX and NYA Updates: Long-Term Resistance


Monday's update anticipated that the S&P 500 (SPX) was headed directly to new highs, and confidence in that view was added during Monday's session, when SPX broke, back-tested, and held 1867.  Tuesday's session closed at a new all-time high.

In today's update, we'll discuss the bull and bear cases and the zones to watch for each. 

On Friday, I wrote: "Due to the larger trend, this is probably bears' last shot to break these markets down, so any strong bounces from here would likely lead to new highs."  That now applies to bulls in reverse (sans larger trend, of course). 

If the market is indeed plotting the head-fake whipsaw I talked about on Monday, then we're likely to see a significant sell-off afterwards, as most traders will be caught wrong-footed.  This is because classic technical analysis would see a breakout here as very bullish, with targets in the mid-to-high 1900's.  After we examine the preferred count and the arguments in its favor, we'll also delve into those more bullish potentials in a bit more detail.

The preferred count continues to see this pattern as a triangle, which has either taken the form of a symmetrical triangle or an ending diagonal.  The pivot between those two options is 1887. 


Here's a more detailed look at the potential symmetrical triangle, using the NYSE Composite (NYA):


SPX reached the key 1885-87 pivot yesterday, but in the event it sustains trade north of 1887, then the symmetrical triangle is in play.  Interestingly, the textbook target for the symmetrical triangle also represents a long-term resistance zone.

I think one of the goals of trading ranges is to wear everyone out -- and in doing so, ranges sometimes serve the function of making traders a bit sloppy afterwards.  While the range is underway, everyone becomes hyper-focused on the near-term charts; then some feel thrilled or relieved when the range finally breaks.  Trend followers sometimes even become strangely complacent afterwards, due to the emotional release of stored tension that was generated by the range.

But I'd suggest we stay alert even if there's a sustained breakout over the 1887 pivot, because we have resistance showing up on the long-term chart, right near the symmetrical triangle's target zone:


So, put simply, the preferred count currently still anticipates that the new highs will turn into a head-fake and whipsaw -- but let's talk about the more bullish option as well.

Prior to the development of the apparent triangle trading range, I had been viewing the bull potential as wave i-up of v-up complete, with the correction as ii-down of v-up (now also complete), and iii-up of v-up still to come.  The series of apparent three-wave moves which created the trading range gradually drew me away from that wave count.  At the moment, I'm no longer favoring it -- but because three-wave moves aren't always what they seem, my original bull count isn't dead and I still have to continue to respect as a viable option.  That option will likely regain favor as the preferred count if the market sustains trade north of 1914. 

In conclusion, the preferred triangle count accurately predicted the end of the trading range and the immediate new highs, which gives some additional credence to that count.  Of course, we don't want to get too far ahead of the market or too rigid in our expectations, but the pivots continue to bear watching as potentially-important reversal zones.  For the time being, I'm continuing to favor the view that the anticipated new highs are part of a terminal pattern.  Trade safe.

Follow me on Twitter while I try to figure out exactly how to make practical use of Twitter:
 @PretzelLogic


Reprinted by permission; Copyright 2014 Minyanville Media, Inc.


Wednesday, March 5, 2014

SPX Reaches Critical Inflection Point: A Look at the Bull/Bear Battle Lines


Well, we have an interesting market now.  I don't trade news, but everyone who does has had a bad news event to sell, followed by a good news event to buy, both within the prior few sessions.  And both basically the same event.

So, those bulls who were waiting for a "good news event" as the signal to go long have gotten it, and should now be long. (The really good news, of course, is the fact that Taco Bell has finally resurrected their Chili Cheese Burrito.  Do not let me get started on this topic...).  Other bulls have been waiting for a breakout to new highs as the signal to go long, and they've gotten that, too.

The question now is: How many buyers are still left to chase the market higher here?  It's decision time.

One of the things that bothered me about the turn at 1867 was the bad news event that came with it.  I'm always suspicious of "bad news" tops -- the best tops are made on good news, in order to pull in the last buyers and trick everyone into continuing to look upwards.  A good top isn't one where people are shorting the bounces afterwards -- it's one where people are buying the dips.  In other words:  "bad news" tops are usually too obvious to work, and they're too easy as a contrarian play.  The exception to this is tops which are marked by incredibly major, world-altering events -- but, interestingly, those events usually seem to come weeks or months into a turn, after the market has already topped on a good news event.

Back to the present (no relation to the direct-to-DVD sequel, starring a much-older Michael J. Fox):  I can see both sides of the trade here, and they strike me as pretty even at this exact moment.  Bulls have a breakout and back-test of falling support in their favor; but at the same time, so far there's been a bit of "failure to launch" -- each prior breakout has been turned back rather directly and the breakout levels have failed to act as support.  That behavior needs to change for bulls to gain momentum. 

The upside for traders is that this has turned into a massive inflection point for the market.  I discussed this in passing at the end of last month, but the near-term charts are now helping to clarify some of the key levels.  So today we'll look at the bull/bear battle levels -- and the targets which are suggested for the victor of those battles.

First up is the S&P 500 (SPX).  The two highest-probability wave counts here (and minor variations thereof) are 180 degrees reversed from each other.  The bear count has the market within a topping process (bottoms are often "an event," but tops take time).  The bull count has the market on the verge of a third wave rocket launch.  1895ish appears to be the dividing line between the two options.


For more perspective, let's refer back to the long-term SPX chart I published on February 28.  The chart below is materially unchanged since then -- but as outlined above, the near-term chart is now helping to point the way in identifying the key levels.


A related signal chart, which I've posted a few times in the distant past, is the ratio of high yield corporate bonds to the 20+ year treasury bond fund (HYG:TLT).  This ratio serves as an effective barometer of the market's current appetite for risk.


In conclusion, the market has bent and stretched the wave structure a bit recently, and this has created a nice inflection point for traders.  The market now appears to be on the verge of a big move, and the noted key levels should help point the way.  Trade safe.

Follow me on Twitter while I try to figure out exactly how to make practical use of Twitter:
 @PretzelLogic

Reprinted by permission; Copyright 2014 Minyanville Media, Inc.


Wednesday, June 5, 2013

Bulls and Bears Squaring Off at a Major Battle Line


Yesterday's outlook gave 55% odds to the idea of a wave (2) top for the S&P 500 (SPX), marked on the chart as either 1643 or 1647, and the market reversed strongly off the 1647 level, then declined all the way back to retest Monday's low.  For the near and intermediate term, this is now a potentially dangerous setup for the market.  I'm continuing to favor the bears for the foreseeable future, but since I'm not a perma-bear, I'm also looking for signals which could indicate a bottom.  In this update, we'll discuss both arguments in detail.

There's an upward market bias inherent with the QE-Infinity program, and the market has rallied virtually nonstop since that cash started hitting the Primary Dealer accounts in November.  The notable exception to this endless rally was the weeks leading into the fiscal cliff dilemma (late last year).  As it turned out, during the end of 2012 the Primary Dealers were withholding that cash from the market, due to their discomfort with the entire situation.  Keep in mind that a similar thing could happen at any point, so QE-Infinity in itself does not guarantee a market without corrections.  Further, if liquidity is being destroyed (somewhere down the chain) faster than the central banks are creating it, then the market environment becomes deflationary. 

All that said, I still don't favor the idea of 1687 being a long-term top, but as I wrote on May 23:

In conclusion, the long-term presently remains pointed higher, but that may be irrelevant at the moment.  We can't see around every bend in the market, but most times we don't need to: the near-term appears to be pointed downwards, and the intermediate-term, while too early to confirm, also looks likely for further downside.  This is not a bad time to behave defensively.

Though I've been bearish since 1687, my long-term bias remains bullish, and this leads to an interesting cognitive situation.  I'm not sure how to put it into words exactly, but I'll try:  I "want" to find a reason for this market to bottom, but I'm not seeing it yet.  In fact, my work suggests that if the 1622 level fails, we could actually see a significant sell-off.  Right now, the bull patterns I'm finding (from an Elliott Wave perspective) are obscure patterns that are generally low-odds, while the high-odds patterns continue to favor the bears, as they have ever since the reversal at the all-time high.

Long-time readers know that I attempt a feat many believe is "impossible" with these updates:  I try to predict the market across virtually every time frame (short, intermediate, and long), three to four times each and every week.  I'm bound to get some calls wrong, and I absolutely do -- but since early May, I haven't missed many and that puts me in a good psychological position right now as an analyst.  I'm not talking about ego in this sense, although this may be something that only another public analyst can probably really understand.  Basically, when you hit a top as well as I hit this one (my May target-2 for SPX was 1680-1690), then you have a lot of psychological wiggle room to really see what's going on afterwards, because you're not trapped by your prior bias/analysis.  When you get caught looking the wrong way, you tend to try and find ways for the market to prove you right in the end (in order to justify the fact that you were screaming to buy at much higher prices, or to sell at lower prices). 

It can be a pretty tough gig actually, and analysts don't get enough credit for the painful crises of conscience that (I assume) we all endure at times after a missed call.  If you've ever wondered why analysts love to toot their own horns when they get a call right, it's not because they want everyone to think they "get every call right," it's because they're trying to compensate for the incredible guilt they feel over the calls they blew.  A small handful of readers love to remind analysts of their bad calls -- but believe me, nobody needs to.  We know our bad calls better than anyone, because those mistakes take up residence in our memories, especially late at night when the house is quiet and still.  In fact, many of us remember our bad calls much better than we remember our good ones.

Moving from independent trader to public analyst over the past couple years wasn't an easy adjustment for me -- the challenges of each role are actually quite different.  But I digress.    

I think the market's in an interesting position here, from a number of different standpoints.  In terms of sentiment, bearishness has increased recently, but the BTFD ("buy the friggin' dip!") mentality is still reflexively strong, and we've been hearing a lot of "buy the dip" talk the whole way down so far.  This in itself bothers me, because I feel like the long trade has become almost too reflexive and easy at this point.  I know that during last week, I was one of the few lone nuts suggesting we sell the bounces, and many were suggesting the opposite.  Anecdotally, that tells me there are probably a lot of bulls now trapped north of 1650.  What's most interesting is that even many bears seem afraid to sell into this rally.  And why wouldn't they be, after being beaten to death since January?  Maybe a better question is:  could they, even if they wanted to?  I know there are several popular bear subscription services who've recommended heavy short positions all the way up (some with stops I consider outrageous), and I can only imagine that many of their subscribers are dead broke by now.

So, my question is:  are there even any bears left to sell short this market?  Because if the only sellers remaining are bulls, there could be a problem.  Short-selling gets a bad rap from some folks, but the reality is shorts provide an important layer of support for the market, because at some point down the line, shorts have to buy back whatever they sold.  Additionally, shorts tend to trip all over each other trying to cover their positions en masse, which is why bottoms usually have the classic V-shape -- and shorts are generally the ones who kick-start the momentum for the next rally leg.

On the other hand, bulls all by themselves make "bad sellers" because they are simply trying to get out, often in a rush, and they have no requirement to buy back in; bulls can sit in cash or government Trashuries for as long as they want.  As a result, a decline without short covering can be fast and brutal.  Remember the last time the U.S. banned short selling (of 799 financials), in 2008?  How did that work out?  (Hint: not well; prices fell more than 12% over the next 14 days.)

So my bottom line point here is:  While I've stayed bearish since the 1680-90 target was hit, I still "want" to find a reason for the market to bottom.  I think a lot of people are feeling the same way -- and that tells me we have to be extremely cautious, because when everyone's looking the same direction, the market has a tendency to do the exact opposite.  Let's take a look at the arguments for both cases.

Starting off with the bear case, we have a few patterns that aren't terribly encouraging for bulls, and which I first called attention to on May 30.  The SPX chart below should be examined in conjunction with the NYSE Composite (NYA) chart shown later.


If we look at this purely from the "trade what you see" perspective, we find the cleanest wave count is the bearish nest of first and second waves shown below.  I remain marginally in favor of this count, but I am quite alert to the fact that this is (suspected to be) a fourth wave decline, and fourth waves rarely follow the "most obvious" pattern.  They usually turn infinitely frustrating at some point, and become all but impossible to predict.

Note the black "alt: (2)" as the current wave could become more complex.  In either case, if the count shown in blue and red is correct, there should be downwards acceleration coming when 1622 is claimed.  If there is no downwards acceleration on a breakdown, then we have to give weight to the "less obvious" wave counts.  Again, I'll discuss this in a bit more detail on the NYA chart.


The hourly chart has now been updated with target 3 potential -- beyond that, there's been no change in a while.

Tuesday, February 19, 2013

Understanding Technical Analysis Using the Current Market


In the pre-market update of February 14, I anticipated that 1514 would become an important short-term support level, and so far the market's bounced twice from that level.  I'm going to use this opportunity to unveil a bit of the "magic" behind technical analysis, and discuss some of the logic behind it, and a few of the reasons why anticipating future price action based on technical analysis works more often than it doesn't. 

The 10-minute SPX chart now sports a pretty decent triangle consolidation, which has been formed with two rejections at the 1524 level, and two bounces off the 1514 level (see chart below).  1514 has been tested several times now, and support becomes more important each time it's tested.  In a moment I'll discuss why.  I'll also discuss why we can further anticipate that this is now quite likely to have turned into a market where additional buyers will show up at higher prices, while additional sellers will arrive at lower prices.

Everybody knows the rule that support tends to become resistance and vice-versa, but I don't know if everyone has thought through why this happens.  Investors who think that technical analysis is some kind of "voodoo" clearly haven't thought much about it, but it's all very interesting to me from a psychological standpoint. 
Let's say the market is moving down to test support.  As it hits support, bulls are buying, which usually causes the market to bounce, especially on the first test of support, and sometimes on the second test or beyond.  But, obviously, it doesn't bounce every time (if it did, of course, then trading would be ridiculously easy).  On the times that support fails, we end up with many of the bulls who bought the level earlier now trapped at a loss -- particularly the ones who bought on that last leg down, just before support broke.  When support fails, the breaks are usually fast, and trap more than a few people, since most traders won't put their stops that close (unless they're scalping; nobody wants to get whipsawed out by a few points).
Shortly after the break, the majority of the time the market rallies back up to the zone that broke -- so if you bought it earlier, you have a decision to make: do you take the chance to exit very close to break-even, or do you stay long and strong with your original stop?  If enough of the trapped bulls do decide to take that exit, then that prior support zone becomes resistance, as the market gets hit with a wall of sell orders on the rally.  If the bulls are of high conviction and don't sell, or if the market has simply exhausted its sellers (sometimes "too many" stops are run when the break happens, and you end up with traders chasing back into their original positions), then you get a whipsaw.
Let's study a real-life example, using the 10-minute S&P 500 (SPX) chart.  When we study this chart a little more closely, we can see that sellers came in at 1514 in a pretty big way on two occasions during the first week of February (on the way up).  Unfortunately for some sellers, due to the gap up on February 8, it's a fair bet that any sellers who came late to the party got trapped short.  We can then see the back-test of 1514 on February 11, and further reason that some of those trapped sellers surely elected to cover their positions -- but it's unlikely that all of them did.  SPX has only moved up about 10 points since then, so it's also a reasonable bet that a fair number of swing-trader bears are still holding onto their shorts.
Looking to the upside, 1525 has rejected the advance twice, and thus now becomes an obvious stop-loss level for shorts.  Typically, most traders will leave a bit of cushion beyond the obvious level, so we should assume 1525 plus a few points.  The chart also shows us that ever since February 8, the market has been in a battle between buyers and sellers -- the pinball back and forth action tells us that bulls and bears are pretty equally balanced in this zone.  And that then tells us another piece of information about 1525: if the market does more than take a quick peek above that level, additional buyers should show up in the form of short covering (and possibly also in the form of bulls who are hoping to buy in lower, but will feel the urge to chase a break higher).  The reverse is true of 1514 on the downside: 1514 (minus a few points) has become an obvious stop-loss level, so we can make a reasonable assumption that additional sellers will show up below that level.  This is why the triangle breakout or breakdown can be projected to run at least 10 points. 

So, sustained trade beneath 1514 is very likely to lead to a test of the next support shelf, in the 1495-1500 zone, where buyers are likely to show up again.  Sustained trade above 1525 is likely to lead to 1535 (+/-), where many short-term traders will take profits.   
Technical analysis really isn't a bunch of voodoo, it's simply based on trader psychology.


We've discussed and charted the triangle above.  In classic technical analysis, triangles typically show up as continuation patterns to the prior trend, which in this case was up; more rarely, triangles are reversal patterns.  In Elliott Wave analysis, triangles always show up as continuation patterns, but typically show up as the penultimate (second to last) wave in a waveform.  There are two challenges here for Elliott Wave: the first challenge is determing whether or not this is a true Elliott triangle, and thus "destined" to resolve higher.  The second challenge is which wave it would actually complete if it is a triangle.  Neither question has a clear-cut answer right now, so this becomes a bit of a "confirmation" market.  Trade below 1514 would rule out an Elliott Wave triangle, while trade above 1525 would largely confirm it. (continued, next page)

Wednesday, June 27, 2012

SPX Update: Questions for the Short-Term, but Long-Term Bearish

Let's recap what we know for sure:  Monday hit my anticipated target perfectly, and there are now five waves down on the S&P 500 (SPX), which satisfies the minimum expectation for Minute Wave-i -- as such, the larger expected wave-ii rally might be underway.  After Minute Wave ii completes, it is expected that Minute Wave iii-down will travel beneath the 1266 swing low.  Ultimately, the larger degree Minor Wave (iii) should travel into the 1100's. 

I have some questions over the short-term, though, and the only one capable of answering these questions is the market -- hopefully in the next session or three.  Here are my short-term questions:
  1. Is the current rally Minute Wave ii, or the lower degree Minuette Wave (4)? (I'm favoring the Wave (4) interpretation.)
  2. Is the current rally over?  (I suspect it is -- though it could have one more slightly higher high.)
  3. If the rally is Wave (4), will Wave (5)-down extend and blow through the lower target zone?

I'm favoring the idea that this corrective rally has about run its course, that it's Minute Wave (4), and that the market will make a new low beneath 1309.  I'm split on the idea of an extended fifth wave here, and there's really no way for me to know in advance. 

For the intermediate term, I strongly suspect that Minor third wave down is now underway, but the caveat is that the market needs to confirm with a print beneath 1306.62.

If my preferred intermediate outlook is correct, and we are now in the early stages of a Minor degree third wave decline, then there are some things to be aware of.   Third waves are powerful, especially third wave declines, and bounces will be muted and sometimes fall short of targets.  Third waves gain their power from the fact that the majority have been caught wrong-footed.  If you're on the wrong side of the trade, expect this wave will not let you out without damage -- because everyone else will be trying to get out too, and that will keep the bounces muted. (This is relative to the time-frame of course -- Minor degree waves last weeks to months, so I'm not talking about day trades.)

So, third wave declines require the majority to head into them positioned long.  Here's the funny thing about sentiment: I suspect that the majority of people wouldn't really believe my projections, because if they did, then we couldn't have an extended decline.  People who think the market is headed significantly lower aren't holding equities; they are either short or flat.  And people who are short or flat have nothing to sell to drive the market lower in the first place -- so if I'm right, the majority are still long right now: it's something of a requirement. 

Right around the time the majority turn bearish, it will be time for a large bounce.

Let's move onto the charts, and take a quick look at the intermediate picture.  The questions I outlined above are reflected on this chart (as well as the next one).  If Minute ii-up is underway, then just move all the blue lines over to the left.


Next, the short-term chart, and the expectations of the wave (4) count.  After re-examining the first stage of the decline, I have moved the Minor (ii) high to match the price high at 1363.  I now suspect that the move from 1363 to 1346 was, in fact, the first wave... though it looks a bit odd because it had an extended fifth.  This also matches the strength of the recent decline into the 1309 low, since that would still be a portion of the Minuette wave (3). 

The alternate black count may or may not have more rally left in it.  If the market does more than a very marginal new high, suspect the black wave ii count.  Conversely, if the move starts to accelerate lower from here, suspect either the extended fifth or the alternate count, and we should start looking for lower targets.  If this is a standard fifth wave decline, it should make a new price low, but there should be numerous bullish divergences on the indicators when it does.


In conclusion, the short-term was dead-on clear last week and I hit the last 3 turns almost to the penny, but things just aren't always that clear, unfortunately, and the short term is now a bit hazy.  It will clarify again soon enough.  Regardless of the market's short-term path, the intermediate term appears decidely bearish.  Trade safe.

Reprinted by permission; Copyright 2012, Minyanville Media Inc.

Friday, June 22, 2012

SPX Update: Rally Likely Over -- Ready for the 1100's?

With Thursday's solid decline, it's likely that wave (ii) ended at 1363.46, about a point and a half shy of my target zone.  In my defense, it appears that the final fifth wave up most likely failed, which accounts for the target short-fall.  There is one last short-term hope remaining for bulls, but it's lower probability at this stage -- I'll cover that option in a few moments, but first, let's take a look at how my Elliott Wave analysis is doing overall for the intermediate picture.

Below is the preferred count I published on June 1.  The decline fell 6 points shy of my target zone (and the red wave (ii) illustration here was never meant to be anything other than a rough guideline) -- but overall, it's probably safe to say, "not too shabby."  This is one reason I stick with Elliott Wave as my go-to analytical tool:  I simply know of nothing else that can call two intermediate turns this accurately before the first turn has even happened.


Let's update that hourly chart, add in some more clutter, and see where we are now in the intermediate picture.  My wave (iii) targets have been slightly adjusted from the June 1 chart.  Bear in mind that the market is a living, breathing, dynamic environment -- so further adjustments will likely need to be made on the fly.


Next, let's zoom in a bit to the 15-minute chart.  I am uncertain if wave 3 has bottomed or not, so don't bank on that wave 4 bounce -- instead watch the red dashed trendline in the one-minute chart (shown next).  My best guess is that 3 has reached a possible very short-term bottom (or nearly so), based on the one-minute chart, but it's not entirely clear.  Yesterday's 18 point bearish trade trigger target (which I've removed from the chart) was easily reached during the session.


Below is the one minute chart.  These can be extremely tricky to interpret and my confidence in this particular instance is only medium.  The chart does note the invalidation level for the bearish wave (4) interpretation (1347.39). 

Again, don't necessarily bank on that wave 4 bounce here.  As long as the market stays below the dashed red trendline, bears have no reason to fear anything; breaking that trendline is the first step for bulls to get something going.


Next is an indicator chart I haven't had the opportunity to share since late last year.  This indicator combines the readings of TRIN (a breadth indicator) with the down volume to up volume ratio (which indicates selling pressure), and shows that when the two indicators reach the signal line in concert, it becomes extremely high probability that there will be lower lows made in the near future.  This fits with my interpretation of the wave structure, but it's always nice to have some additional confirmation.

By the way, the last time I referenced this indicator (December 2012), it failed to work!  I don't think that will be the case this time, though -- the odds are definitely against a second failure here, so there should be lower lows in the market's near-term future.


Finally, I do want to outline an alternate intermediate possibility.  This potential is lower probability, but there's no way to rule it out yet.  The strength of the decline was fully appropriate to kick off the assumed third wave, so there's currently no reason to to think a double-zigzag will develop here -- but we'll stay alert to this going forward.

The main purpose of the chart is actually to outline the very bearish 190 point sell trigger which will be activated with a breach of the lower dashed blue trendline, but I figured I'd save space and annotate the alternate count onto this chart too.  The bearish sell trigger also jives with the idea of a third wave down.  My preliminary target zone for the larger third wave is 1120-1130, but that would not mark the entire wave down -- there would still be a fourth and fifth wave, which, if correct, should allow the market to reach the trigger target in the high 1000's.


In conclusion, it appears reasonably likely that the market has begun the expected third wave decline.  Third waves represent a "point of recognition" for the masses, and they tend to be strong and unrelenting.  Discounting the alternate potential for a moment: if this is indeed now wave (iii) down, then bounces will often come late; upside targets for bounces will frequently fail; oversold indicators will reach deeply oversold conditions and stay pegged there; and declines will run deeper and faster than most think they should.  Trade safe.

Reprinted by permission; Copyright 2012, Minyanville Media Inc.

Friday, May 25, 2012

Understanding Elliott Wave Analysis, Part I


In this series, I’m going to attempt to explain a bit about market analysis, with a focus on Elliott Wave Theory.  Later in the series (after we’ve covered the basics), I’ll share some ways to utilize these tools for your own benefit.  A small portion of this has been reprinted from some of my earlier articles, so if it sounds familiar, that's because I plagiarized myself.  My attorney assures me that I am immune from litigation, but I have filed suit against myself anyway, because I can't have people stealing my work! 

Anyway... First, I do want to briefly address fundamental analysis.  My primary focus as a trader involves technical analysis, for reasons I will explain shortly – however, unlike many technical analysts, I do believe that fundamental analysis has value.  I believe it serves as a foundation to interpreting charts across the longer time-frames, and aids in understanding what is possible and likely.

Conversely, some fundamental analysts seem to believe that projecting the market using price charts is some kind of “voodoo.”  I suppose this is understandable; most things we don’t understand carry a certain mystique to them.  It’s important to realize that price charts, all by themselves, contain all the collective knowledge about a stock or index. 

People act on what they know or believe, so it stands to reason that people buy or sell securities based on what they know and believe -- thus(and here’s the critical point about technical analysis) everything known about a given security by all the shareholders collectively is reflected in a price chart.  When an insider makes a trade, it influences the price of that security, and leaves a clue which can be read on the chart.  When a huge hedge fund gains a piece of critical information (usually well ahead of the public) and starts buying or selling a specific stock or commodity, that action leaves its mark on the charts… and so on.   Thus the charts point the way ahead.   

The goal of a fundamental analyst and a technical analyst (one who studies charts) is the same:  they both seek to project the future.  Their methods, while seemingly different, are also quite similar in many respects.  For example, a fundamental analyst might look at Apple and try to project how many iPhones and iWidgets will be sold next quarter, and how that will influence profits, growth, etc.   Then he takes all his research numbers and derives a projection of the company’s outlook -- largely based on what’s happened in the past.  He then plugs that projection into a formula to arrive at a future share price target, which is also based on how things have performed in the past. 

A technical analyst does the same thing, except he looks at the charts directly (which, as we just learned, contain all the knowledge of the collective) and cuts out the middle man.  He seeks patterns which convey information:  When price has moved up by x number of dollars, and then moved down by x percent to create a certain pattern, how has the market usually performed in the past? 

Both forms of analysis are based on past performance and on future probability – they just get there by different means.

The weakness to fundamental analysis is that there are a great many variables which the analyst simply cannot foresee.  Study what happened in 2007-2008 for an example.  Many stocks looked great, and projected earnings looked great, and their futures looked so bright that everyone was wearing shades – but their share prices collapsed anyway, in a spectacular fashion.  In September 2008, did anybody care about how many iWidgets any given company was projected to sell in the fourth quarter of that year? 

Some fundamental analysts saw what was coming back then; others didn’t.  Likewise, some technical analysts saw what was coming (myself included) and others didn’t.  But the probability of a crash was all telegraphed well in advance on the price charts – one didn’t even need to turn on the TV to see it coming ahead of time. 

The big advantage to technical analysis: we technical analysts were able to arrive at actual price-targets for the crash, in real-time, while it unfolded.   Fundamental analysts knew it was “gonna be bad!” but that type of analysis is simply unable to time the market with that degree of accuracy.  This is why the majority of fundamental analysts don’t even try to time the market, except in broad strokes: their system is ill-suited to it.

So, now that we’ve gotten that out of the way, let’s discuss a more detailed form of technical analysis, called Elliott Wave Theory.

On the surface, Elliott Wave is a unique way to understand why the market does what it does, and a detailed tool that allows us to project future price moves by extrapolating the fractals and patterns found on the charts. The theory runs far deeper than that, though.

At its core, Elliott Wave helps us to understand something much more meaningful than markets: it helps us to understand human nature. The patterns formed in the market are, in part, a direct reflection of investor knowledge, and more importantly, investor sentiment.  Like most things in the world, sentiment fluctuates in cycles. 

You can observe the symptoms of this cyclical tendency in the news reports.  One week, you’ll see nothing but happy headlines, as sentiment hits a positive cycle and everyone forgets about all the troubles in the world:

“Rally Takes off as Market Cheers Job Report”

“Stocks Rise as Greece Agrees to Austerity Measures”

“Dow Closes Higher after Bernanke Announces He’s Dying His Beard”  (If you were rooting for that sentence to end without the last two words – shame on you!)

Then a short time later, it’s as if everyone forgot how “good” everything was just a few minutes ago, and suddenly it’s nothing but bad news again:

“Rally Crumbles as Market Boos New Jobs Report, Which Was Pretty Much Exactly the Same as the One They Cheered Last Month”

“Stocks Collapse as Investors Realize They Don’t Actually Know What Austerity Means”

“Dow Suffers Biggest One Day Loss on Record when the Market Realizes It’s Afraid of Snakes”

As I’m sure you’ve seen, even the exact same news item can be received well on one day and poorly on the next – highlighting my point that sentiment is cyclical. In reality, outside of certain “black swan” events, the news doesn’t drive the market directly -- it merely reports what the market did after the fact and attempts to explain it.  Otherwise, good news would always cause the market to go up, and bad news would always cause it to go down.  But as you’ve certainly noticed, it doesn’t work that way.  

The other problem with news is that, even if it was a prime mover for the market, it always arrives too late for you to make use of it.  If you’re dead set on trying to assign a “reason” for what the market did that day, you could simply look at the closing prices to figure out whether sentiment was good or bad (up = good; down = bad), and then make up your own random explanation, just like the news does: “Market Crashes As Investors Realize that Your and You’re Are Actually Two Different Words.”   

Fortunately, we don’t need to pay attention to the lagging-indicator news, because these sentiment cycles often leave clues telegraphing their arrival and departure.  These clues are found in the price patterns.   As we discussed, all the collective knowledge of investors is reflected in the numbers on the charts.   By tapping into that knowledge, Ellliott Wave Theory can, at times, recognize and anticipate the sentiment and cycles in advance.  And since sentiment goes a long way toward driving the price, we can then either:

1.   Anticipate the market’s future price movements before the moves actually occur, or;

2.  Gain a reasonably accurate window into what’s likely to occur if the stock or index crosses a certain price threshold.

The market's price movements are, in the end, a reflection of human nature.  And here’s where things become truly fascinating:

By rule of intrinsic design, human nature must be universally reflected in all human constructs, be they markets, governments, or otherwise.  Once you unveil one universal aspect of human nature, you are often able to locate the same common thread running throughout other human activities. This is one of the fascinating things about Elliott Wave Theory:  it seems to apply to patterns found not only in markets, but in the rise and fall of nations, and even entire civilizations (as well as the ebb and flow of many other things in the natural world). I have studied and applied it for many years, and continue to be in awe of its frequently-uncanny ability to anticipate the future.

It is important to note that Elliott Wave Theory was derived from back-testing.  Back in the 1930’s, R.N. Elliott studied decades of charts at various time frames, and discovered that there were certain patterns  which repeated across all time frames.  These patterns were of a fractal nature; in other words, the patterns on the one-minute chart join together to make up identical larger patterns on the hourly charts, which in turn make up identical larger patterns on the daily charts – and so on.   He developed Elliott Wave Theory as an attempt to quantify and explain these patterns.

In the next chapter, we’ll examine the underlying patterns that form the basis of Elliott Wave Theory, and we’ll take a look at some past and future predictions made using the theory.  This concludes part 1 of this series. 

(Part II can be found here)

**********************************************

Onto the charts now. 
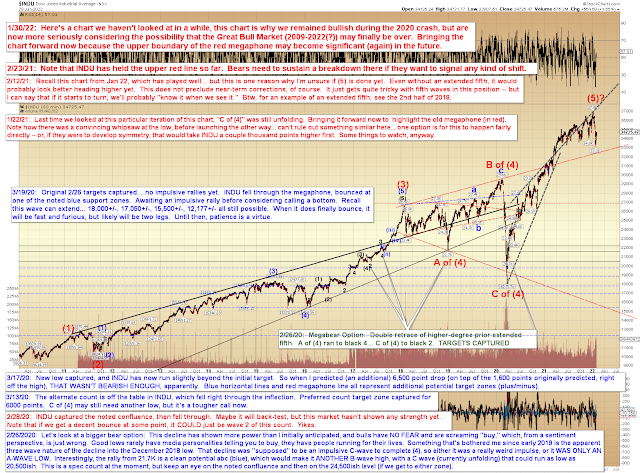
Short term, there are still some questions as to what the market's next move is.  The minute this wave started, I warned everyone to be on guard for a complex and unpredictable correction.  Waves in this position often take strange forms.
As if for emphasis of this point, yesterday's action opened up the potential of a triangle in formation.  This pattern should be easy enough to confirm or deny, as trade above 1328.49 would eliminate it from consideration.  Conversely, if the market bounces back and forth between the triangular blue lines, then we can cofirm this pattern. 
If the market does rally above 1328.49, I will most likely shift my preference to the alternate count.  This alternate currently appears quite reasonable, and is a pattern called a "double zigzag."  A double zigzag (in this case) consists of two 3-wave rallies connected by a three-wave decline.  The first rally is labeled as a-b-c to form (w), the decline is (x), and the second rally leg is a-b-c to form (y) -- with (y) being the final wave of the rally.  The chart shows the rally from 1292 to 1328 as one potential a-b-c for (w), and the decline back to 1294 being (x).  If this count is correct, yesterday's high marked the peak of wave a, and the decline to 1310 likely marked the bottom of wave b.  Wave c-up would now be underway.  The first target for that count would be 1338-1340; the second target would be 1352-1355. 
Again, the double-zigzag gains preference only if 1328.49 is broken.


My intermediate expectation for the decline to reach the mid-1200's is, as yet, unchanged.  If the bulls could reclaim some key levels north of 1375, my outlook would need to be reconsidered.

The next chart shows that bears have fired a strong warning shot across the bow.  The top indicator panel depicts the Relative Strength Index (RSI), and shows that this month's decline officially entered into bear market territory.  We can see that, since the March 2009 bottom, this has only happened one other time, and that was during the 2011 "mini-crash." 

The other two indicators have not yet confirmed, but if the market proceeds to decline into the mid-1200's, then these indicators almost certainly would confirm my view that the market has (most likely) seen a trend change at intermediate degree, and will ultimately head significantly lower. 

It's by no means a "done deal" for bears yet, but the evidence is mounting.


In conclusion, in early May, I stated that a close beneath the key S&P 500 level of 1380 would strongly favor the bears going forward, and I projected a decline to 1300-1310.  So far, that's been exactly the case.  There are some levels which could turn me back toward bullish, but the bulls have their work cut out for them.  The longer the market hovers around down here, the more dangerous things get for the bulls.  Trade safe.

Reprinted by permission; Copyright 2012 Minyanville Media, Inc.