Amazon

Thursday, December 18, 2014

Bonus Update: No Material Surprises in RUT, INDU's Inflection Point


Another "day off" bonus update...

A quick chart of RUT, which seems pretty straightforward:


And in case I'm wrong on the bull case, here's one potential zone for INDU's next inflection point:


The bottom line is, bulls did what they needed to at yesterday's noted intermediate inflection point, and the long-term trend is still on their side, of course.  Trade safe.

Wednesday, December 17, 2014

INDU, COMPQ, SPX, RUT: Inflection Point on FOMC Day


Over the last 12 hours, I've spent so long staring at charts that when I look at a blank wall and blink rapidly, I can see the ghost image of price patterns.  Since I've run out of time for verbose text, I'm going to be light on words in the body of this article, and let the charts do most of the talking.

Today is, of course, FOMC day -- which means anything goes, and, as is often the case on Fed days, the market seems to have reached an inflection point.

Let's start with COMPQ, which served well as our canary, and which has now officially captured all of my bearish if/then targets (with ease):


Next is INDU, which reveals what I believe to be the most relevant conundrum from an Elliott Wave perspective:


The view of INDU from 10,000 feet takes note of an interesting test underway (continued, next page)

Monday, December 15, 2014

SPX and RUT: Bull Case, Bear Case


If this had been a normal market for the past few years, then I'd probably already be rabidly bearish.  But this has not been a normal market -- and once bitten, twice shy, as they say.  Or as George W. Bush so eloquently put it:  "Fool me once, shame on you.  Fool me twice, and I'm going to punch some central bankers."

I mean, let's face it, bears have been here a few times before.  It goes like this:

1.  Support levels begin failing, VIX spikes.
2.  The pattern starts to look exceedingly bearish.
3.  CNBC trots out several analysts who all share the nickname "Dr. Doom," and they each talk about how the fundamentals are garbage and the market is clearly headed to zero or below.
4.  Bears see a bunch of green in their accounts and start to feel excited...
5.  One of the major central banks announces some radical new program, such as that it will be providing free, unregulated personal printing presses for each and every banker who'd like one.
6.  SPX gaps up 257 points, and shorts are left running for cover as the market rallies relentlessly.

So are there any differences now?

Well, there is one elephant in the room, and that's the recent, and still ongoing, oil crash.  Needless to say, an oil crash is deflationary, and has the potential to cause a host of interconnected problems.  This is a new twist in the market picture relative to previous recent corrections, so maybe this time bears are for real.

But I think the jury is still out on that.

Let's start with RUT, which has essentially confirmed that its last major correction (from July) was exactly that: a correction.  This implies that RUT needs new all-time highs to fulfill its pattern.  I've been looking at RUT with that bias, and expecting a fifth wave up to new highs.  Some analysts are now saying that RUT must have had a failed fifth wave.  I take issue with that conclusion for several reasons:

1.  Failed fifth waves are the rare exception, and one should only consider them as a last resort.
2.  There's nothing in RUT's chart yet to invalidate a fourth wave -- so a fifth wave up is still entirely viable.
3.  There are other options beyond the simple linear logic that "either RUT makes new highs or it's a failed fifth."

For example, the decline off the all-time high can be corrective, as part of a triangle -- which means the rally since October would also be part of that ongoing correction.  In that case, the rally would be an ABC -- which, without a fifth wave, is, in fact, exactly what it is (as of this moment).

So, I think since the fourth wave has not been invalidated yet, a fifth wave up should still be considered as a very viable possibility.  If no fifth wave materializes, then our first consideration should be that the rally was an ABC and no fifth wave is needed -- and the correction from 1213 is thus ongoing.


Next, let's look at the long-term SPX chart.  This chart is little changed over the past month -- in fact, on November 17, I suggested a target of 2065-75 for the peak of 5.  If the decline continues from here, then we simply got "caught looking" at the top, as it was anticipated well in advance in the big picture.

The December 10 update noted that "Ideally, we are nearing the completion of wave 5 of 5, meaning bulls will want to stay very nimble.  Do note that SPX is now BELOW the blue trend line, which should be viewed with some caution as long as it continues."


So, is it time to call it quits on another wave up?  Well, that's a matter of personal preference, of course -- but objectively, according to the charts:  Not just yet.  As we can see below, SPX has (so far) only formed an ABC decline:


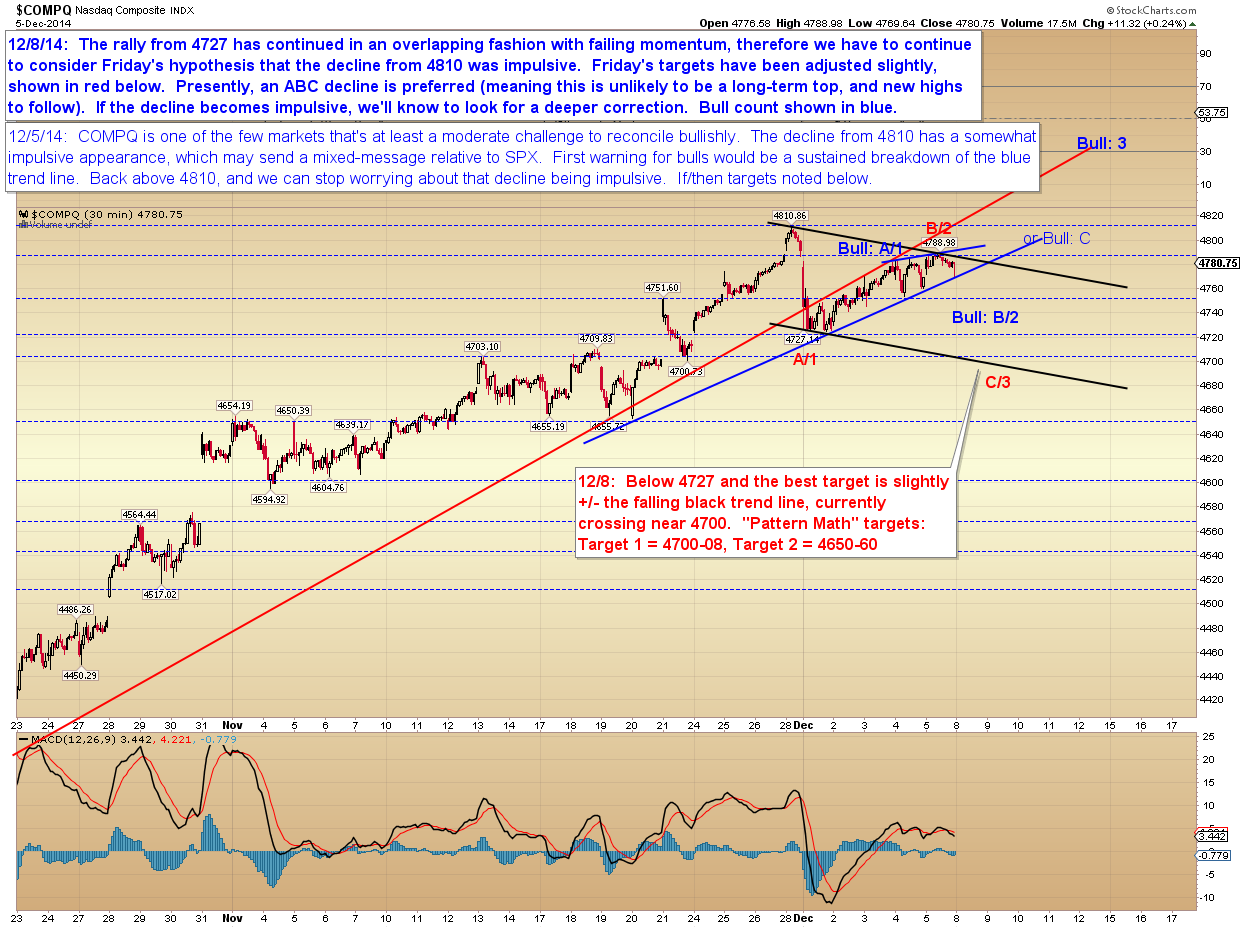
COMPQ is also near an inflection point:


In conclusion, so far, the decline is not impulsive, so bulls aren't out of the running just yet.  The next few sessions will be important, and should help us determine if bears have already seized intermediate control -- or not.  Trade safe.


Friday, December 12, 2014

Brief Update #2: COMPQ Canary Not Dead Yet


I intended today's update to be a comprehensive review of all things bullish and bearish, but my life got in the way and I had to deal with a personal issue.  Hopefully the "bonus update" on Thursday earned me a little bit of credit that can be applied toward today's unusually-brief update.

In any case, I promise a more comprehensive update for the weekend, but in the meantime, I think the COMPQ chart will continue to serve us very well in regards to sorting out the market's intentions heading forward. 

The implications of a breakdown in COMPQ would almost certainly carry, by extension, to SPX and INDU as well.


My apologies again for the short update at an important inflection point.  Hopefully, COMPQ will serve everyone well enough to get through today's session.  Have a great weekend, and trade safe.


Wednesday, December 10, 2014

Quick after-hours update -- COMPQ, Canary in the Coal Mine?


Today's preferred count in SPX was a miss.  COMPQ has, so far, held its key level and the standard ABC remains valid as long as it continues to hold.  But more importantly, this may continue to be the most helpful market for sorting out the noise heading forward:


Trade safe!

SPX, COMPQ, INDU: A Game of Inches

Monday's update was near-term bearish, with three downside target zones, but still bullish for an eventual new all-time high.  All three downside targets were captured and exceeded, and I probably did some over-thinking on Monday, due to all the options for the pattern.  Prior to that, my original concern had been that a more complex wave (4) could form and take SPX below 2049, and it now appears that may be exactly what happened:


A bit more detail on the 15-minute chart:


COMPQ performed right in line with expectations, and the A-wave was indeed a warning for the rest of the market, as originally discussed on December 5.


Let's step away from the near-term charts for a moment, and take a look at the big picture.  I updated this chart for everyone on December 1, but apparently I then forgot to publish it (!) -- so as far as the general public is concerned, I haven't updated the big-picture chart in several weeks.

This appears to be a game of inches for bulls right now, but ideally, I'd still like to see new highs in RUT and NYA  -- and, by extension, SPX (interesting to note that RUT was up 1.8% yesterday).

(continued, next page)

Monday, December 8, 2014

SPX, COMPQ, BKX: Near-term vs. Intermediate Term


Friday's market didn't perform the way a third wave should, and this has left a number of complex options open.  The charts might get a little confusing, so before we get into that, I'm going to give a brief synopsis of my thinking regarding the intermediate term:

1.  RUT and NYA have, so far, failed to make new intermediate swing highs.  Odds are good that needs to happen before a meaningful top becomes possible.

2.  SPY has been up seven out of the past seven weeks.  Over the past 18 years, this has happened seven times (go figure).  In 100% of those prior cases, the market formed, at best, a minor correction before making new highs.  In 0% of those prior cases, the market formed an immediate major top.

3.  Last week, we looked at an RSI top study.  Given the market's behavior in the past, it remains highly unlikely that any kind of final high is in place. 

4.  Therefore, while there is not yet enough pattern present to determine the exact depth of any (pending) near-term correction, I do believe it will simply be a correction, and resolve with new highs.

5.  I currently believe the odds are good for an intermediate correction to follow after the next rally takes us to (presumed) new highs -- but let's not put the cart too far in front of the horse...

With that out of the way, let's see if I can keep the charts from being too confusing.  We'll start with the simple news that BKX (one of several market I had noted) has finally broken its September swing high.  We're still waiting on RUT and NYA to follow suit.


BKX near-term, best-guess:


In SPX, the pattern is so complex that I can spot three different options immediately -- and, due to the larger wave lacking a clear structure, there is no high-probability way to differentiate them.

I went 'round and 'round with myself as to how to present this chart in a manner that wouldn't be incredibly confusing, and I eventually settled on leaving the wave labels off for sake of clarity, and simply highlighting the potential target zones.


Finally, COMPQ remains the fly in the ointment here.  I really want to view that decline as impulsive, yet it's difficult to reconcile COMPQ and SPX.  There are two ways they could reconcile:

1.  SPX was indeed an ending diagonal, and is aiming at the third target zone or beyond.
2.  COMPQ's impulsive decline was wave C of a nearly-hidden flat and the blue bull count plays out.


In conclusion, the near-term is up for grabs.  I only have a half-session-worth of decline to draw from, and the pattern leading into that decline is ambiguous at best, which makes it very difficult to draw a high-probability near-term target zone.  Intermediate-term, while nothing's impossible, market history tells us that it's unlikely that the final highs are in yet.  Trade safe.