Amazon

Monday, March 8, 2021

SPX Update: One for da Bullz

Last update, we discussed the downside inflection that had been reached, and not much has changed since then, as the market continued to hold that inflection.  For reference sake, I did draw up a chart to show the potential intermediate bull count:

[note the typo on the chart below:  "restetsstestsershonish" (or whatever it says) should be "retests"]


Here's a quick repeat of the inflection zone chart published last update, as it shows why last week's low is important for bears to claim:


So far, SPX is working on three up... whether that three up will become impulsive or not remains to be seen.  If it does become impulsive, then we'll have to give additional weight to the bull count -- though the expanded flat mentioned on Friday will still be on the table (more on that if/when it become appropriate).  Trade safe.

Friday, March 5, 2021

SPX and Gold Updates: Been a Great Week for Bears

Last update noted that the rally could be over (for now) via a big WXY, and that count was confirmed with dramatic new lows yesterday.

There are multiple potential counts in this position, so we're going to focus on "keeping it simple" via trendlines today.  We'll start with the near-term SPX chart:


Bigger picture, it's easy to see why SPX is bouncing from yesterday's low:


Also realized there was a typo on the gold chart, so wanted to update that.  Gold reached its minimum downside target yesterday, with its test of the blue/black confluence (but, as noted on 2/28, may still have farther to run):


In conclusion, on Friday, I published "Is the Party Over?" and so far the market is doing everything in its power to agree that the party may indeed be over.  Sure, bears still don't have long-term confirmation... but as I intimated in that piece, the nature of the market is such that by the time there's "confirmation," pretty much everyone is on board.  That said:  On the flip side of my own sentiment (which is "bearish"), SPX did test an important zone yesterday, and bears do need to claim that zone for early confirmation.  Especially if the Fed steps in with more QE.  Trade safe.  

Wednesday, March 3, 2021

SPX Update

The market generated quite a bounce from its first downside inflection zone, but it did complete one potential pattern before the close on Monday (a complex WXY).  After the session on Monday, I published the following chart in the forums:


This makes Monday's high an important inflection for bulls.  Thee chart below (published in Monday's update) has also proven useful:


Finally, bigger picture, bears need to sustain a break at the rising black trendline:


In conclusion, if Monday's high holds, there is at least the potential for this to be a massive bear nest.  And if that high holds, at the very least, we should retest/break last week's low.  If 3914 doesn't hold, we'll likely revisit the zone near the ATH.  Trade safe.

Monday, March 1, 2021

SPX and NYA: First Downside Inflection

Last update discussed some of the things bears would need to do next to help give them greater confidence, and Friday tested a couple of those first zones, but (so far) held.  NYA provides first case in point:


Thanks to the nature of expanded flats, SPX has left open too many potential patterns:


In conclusion, we're near/at some of the (first) downside inflections discussed on Friday, so bears and bulls alike need to be prepared for possible market "shenanigans."  Recall that inflection zones are always potential reversal zones.  Trade safe.

Friday, February 26, 2021

SPX, Gold, TRAN, INDU: Is the Party Over?

 "I'm all dressed up with nowhere to go,
Walkin' with a dead man over my shoulder...
Waiting for an invitation to arrive,
Goin' to a party where no one's still alive...
It's a dead man's party, who could ask for more?
Everybody's coming, leave your [economy] at the door..."

-- Dead Man's Party, Danny Elfman/Oingo Boingo


We've been anticipating this as a potential "final fifth wave rally" for a while, but some interesting things have happened since last update.  In the prior update, I noted that SPX could still make a higher high, and while it didn't, many other markets did -- including INDU, TRAN, NYA, among others.  Let's start off with INDU's long-term chart, where many past projections have played out very well across time.  The past few times we've discussed this chart, I felt that INDU probably needed to head at least a little bit higher.  It has now done that:


TRAN is another market that made a new high yesterday, and its long-term chart is interesting:


NYA made a new high -- and here's where we might note that from a long-term perspective, there's still work for bears to do before they begin to get anything approaching "confirmation" -- so we are front-running with any speculations that the bull market is over (or nearly over).  A fifth wave extension is still possible:


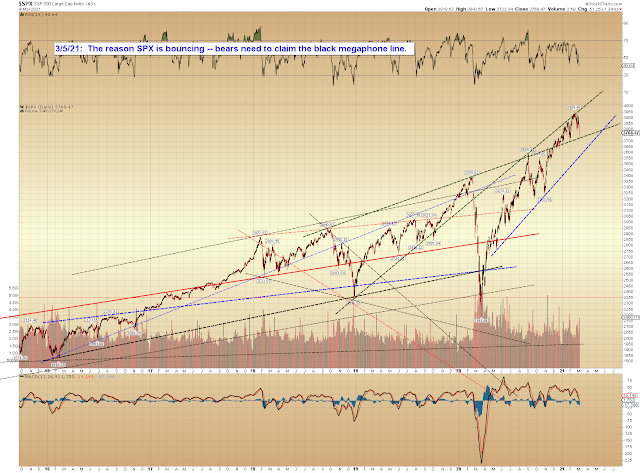
SPX is one of the markets that failed to make a new high -- and it stalled just shy of the first key overlap, which made for as low-risk an exit/entry point as it gets.


Finally, I want to briefly touch on gold, because this chart looks like potential trouble for gold bulls at the moment.  Gold bulls could reset this look (at least a little; it wouldn't put them entirely out of the woods) with trade over the noted level:


So... what does all this mean?  Are we there yet?  Is this the end of the road for the bulls?  On the one hand, there are enough waves up for that to be the case.  On the other hand, we have nothing approaching "confirmation" from the market yet (but, of course, the nature of the game is to try to be a bit ahead of it), so it's a bit early to say with much conviction.  

Thus, in conclusion:  As I've noted a few times in recent past updates, we were approaching the zone where five waves could complete -- and yesterday, INDU, NYA, et al, rallied enough to complete those patterns.  At least potentially -- since it's very early, we still can't rule out a continued fifth wave extension; but bulls now need to prove that is their intention by rallying back over the all-time high.  If they can't, then the market could be in real trouble.  Trade safe.

Wednesday, February 24, 2021

SPX, INDU, TLT: Easy Trade, Complex Pattern

While parts of this have been easy (for example, yesterday declined to and bounced from the 3800-10 support zone), from a pure pattern perspective, this has become one of the trickier markets we've seen in a while.  

First, the simple part:  SPX found support right at the blue support line discussed in the prior update:


Now the more complex part:  Last update discussed options of an ending diagonal vs. a bear nest.  The ending diagonal is off the table, but the market has left open the option of a WXY, as discussed below:


While SPX has been declining (in as choppy a fashion as it could muster), INDU has been grinding sideways, and has yet to fall through its recent breakout:


I also want to call attention to a potential "canary in the coal mine" in the form of TLT.  If bulls can't right the ship in TLT, it's going to start to pressure other markets, including stocks.  


In conclusion, SPX found support right where it should have, making that last trade easy -- but the next trade isn't crystal clear just yet, as SPX has (so far) formed just a three wave bounce.  This makes the zone near yesterday's high something of an inflection (it could move a little higher and remain a three, but not too much higher, or it will start to look impulsive), and keeping both counts discussed in the second chart on the table as of this instant.  Trade safe.

Monday, February 22, 2021

SPX Update: In More Detail

In the prior update, we discussed that the pattern wasn't quite as clean as I'd like and that this meant the market was reserving a couple additional options.  Let's review that, then look at this options in more detail: 

But in cash, it's not quite so clean.  As long as that low holds, we'll assume we're dealing with the gray path as originally shown... but because the structure isn't as clean as I'd like, the market is leaving open two interesting options:

1.  Sustained (and particularly: accelerating) trade below the recent low could suggest a bear nest and a significant decline in the works.  (Be aware that a brief break of the low could suggest an ending diagonal that would resolve higher -- so bears beware whipsaws in the event of any new lows.)

2.  The low might be another b-wave, indicating an increasingly complex flat.  In that event, we'll run up to retest/best the all-time high, then run back down below this week's low, then run back up AGAIN to a(nother) new all-time high.

So we just had a nice little win, but now we'll have to see how the market wants to handle these options from here and track them as they unfold in real-time.  Sustained trade below last week's low would be the second clue that perhaps ALL OF 5 (at current chart degree) has completed (the first clue was the potential for five complete waves, as noted on Wednesday).

Cash held that low for Friday's session, but ES (e-mini S&P futures) has made a new low in the overnight session, so I've sketched out a more detailed look at what the above options might mean:


In the event of a diagonal, we could see some more choppy downside.  In the event of the bear nest, we could see a significant and speedy decline.  It's worth taking another look at a chart I published on February 10:


Keep in mind that all of this is coming on the back of the potential of FIVE COMPLETE WAVES at last week's high, as noted last Wednesday.  Because (as noted) the pattern is a little wonky, I still don't want to get too far ahead of this market, but again, this does at least leave open the possibility that we are at or near an important top.  Trade safe.