Of course, it wasn't so easy for a lot of traders, since many of them thought we might still make new all-time highs -- but I was not among them and I published exactly zero alternate counts to this projection:
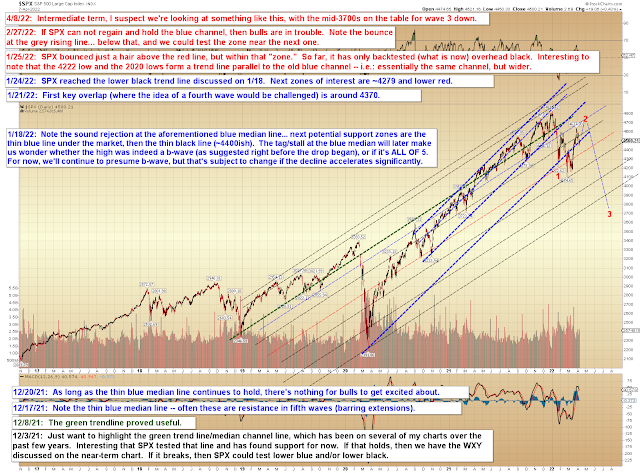

The challenge now is that, while we didn't quite make it to the mid-3700s, we got awfully darn close. Close enough to say that the above projection has basically played out -- and as many readers know, once a projection plays out, the market enters an inflection zone, where it has multiple options for its next path. And during such times, I have to sit back and observe for a minute until the market more clearly declares its next intentions, at which point I can make a new, more concrete projection again.
Let's take a look at that chart as it sits now:
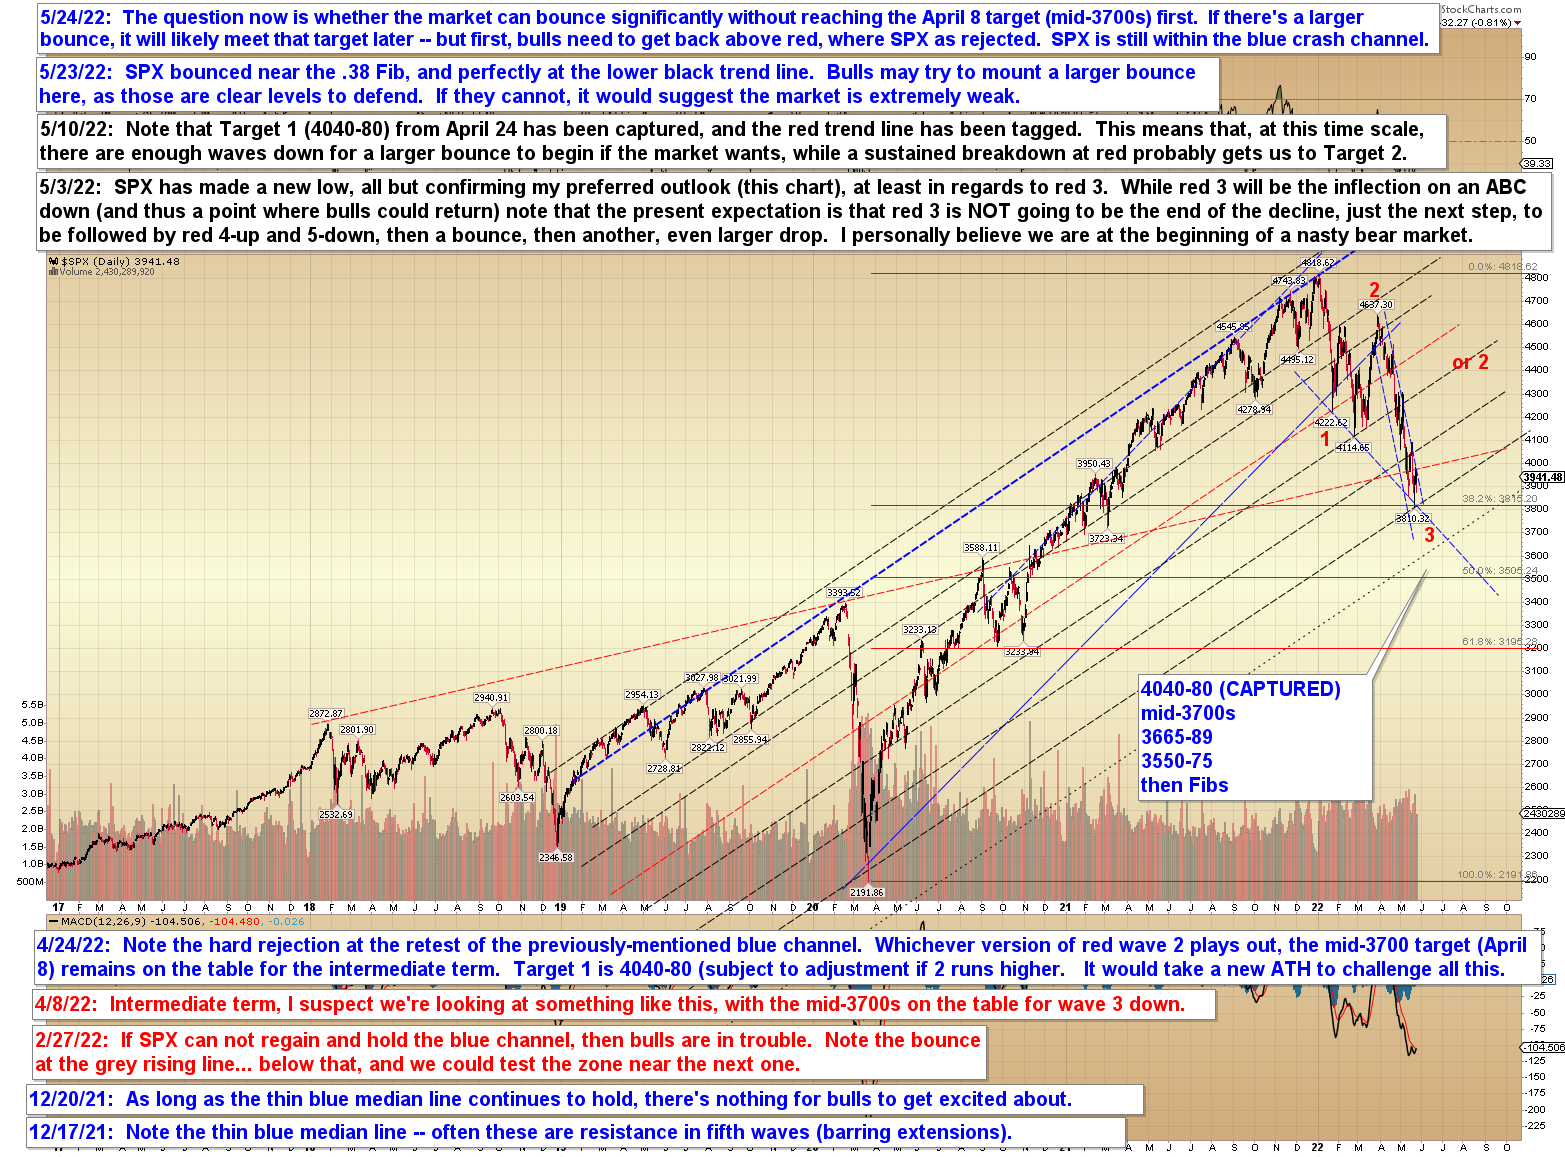
First, I want to mention that in the event I've got this wrong and we have not begun a new long-term bear market, we are in the zone of an inflection for three waves down (i.e.- ABC) from the all-time high, so if you're of the bullish persuasion, this is where you'd start accumulating longs in anticipation that this was "just a correction" and that the market is headed back up.
I have stated my reasons multiple times as to why I'm not favoring that outcome, but it is technically possible, and I'm not infallible.
So with that notification out of the way, the first thing we notice on the chart above is that SPX is still within the blue crash channel -- so that's the first thing bulls need to clear (it lines up reasonably well with red resistance, too). The second thing we notice is that it's a bit short for a third wave, which suggests that either the third wave is still unfolding (perhaps we're in a micro fourth of that third), or it's another nested first wave, or (and we're all hoping for this) it's the good ol' flat we discussed at length previously (below):

Next, let's take a look at the very near-term options:

As we see on that chart, near-term, bulls need to clear 3982, which was close enough to the inflection that the inflection is still active.
COMPQ's long-term chart is interesting:

Finally, the 10,000 foot view of the very long term:

In conclusion, bulls managed a bounce at obvious support, but they still have their work cut out for them and have yet to so much as break out of the established crash channel. That's the first thing they need to accomplish to gain a crack at a larger bounce; if they do, then we have the next immediate targets on the near-term chart (4th chart). If they don't, then we have the larger targets on the intermediate chart to watch (2nd chart). Things will become clearer again soon enough. Trade safe.
No comments:
Post a Comment