Amazon

Monday, April 16, 2012

SPX Update: A Dangerous Position for Both Sides of the Trade

Yesterday's action removed some short term options from the table, but has still left the pattern open to interpretation.  It appears that I had Friday's decline labeled properly as an impulse wave, but that doesn't tell us with certainty whether that impulse was wave 1 or wave a. 

As I've been warning for a few days, I believe bears need to remain very cautious right now.  I'm still quite leary of the (x) wave count. 

Below is the 1-minute chart, which shows the difficulty in nailing down a count with any certainty.


Next is the 5-minute chart.  I'm almost equally split on the odds between wave 5-down having started, and the (x) wave count.  The chart shows the expected outcomes of whichever count is correct. 

If the wave 4 label is correct, then the market should not sustain trade above the red trendline.  If it does so, then suspect that the (x) wave count is playing out.


And finally, the big picture alternate.  It still remains possible that wave (iv) bottomed, though this seems decidedly less likely now that the 1367 price point has been overlapped and locked-in the view the the move from 1357-1388 appears to be a 3-wave form.  I'm more worried about the (x) wave count -- especially since the extended fifth wave practically begs for that count to play out.


In conclusion, I feel the market is in a somewhat dangerous position for traders who end up on the wrong side right now.  There's some room to run in either direction, and there's little help from the market in sorting the impulse count from the (x) wave count.  It's a tough enough call that I'm basically equally divided between the two counts.  I've labeled the (x) wave as an alternate simply to sort each count out.

Beyond that -- from my point of view, since I continue to believe this is the fifth and final subwave of wave (i) down, there should be a big bounce lurking in the shadows soon.  The question is whether the market makes the wave (i) bottom directly, or runs up quite a bit higher first.  If the (x) wave plays out, I doubt bears want to hang on for dear life waiting for it to end.  Trade safe.

Sunday, April 15, 2012

SPX, RUT, Apple, and Beard Updates: Why I'm Not in the Same Camp as Most Wavers Right Now

Beard Update

Ever since this article, where I discussed my ground-breaking decision to venture into the beard-bearing biosphere of Ben Bernanke (by not shaving), I have received e-mails from anxious readers demanding beard updates on an almost-hourly basis.  For example, this recent letter comes to me from Little Bobby of Arizona, TX:

Dear Mr. Logic,

Or should I call you Pretzel?  Whatever -- just please don't refer to me as "little" Bobby if you publish my letter.  I saw you did that to that other guy.  I am 6'8", a linebacker, and I have a really bad temper. 

Anyway, I'm currently working on my economics degree at Texas Arizona University in Arizona, TX, and I aspire to one day be Fed Chairman.  While I appreciate your market updates, I'm really more interested in updates on your beard.  I'm wondering if you think I should grow my beard immediately, or wait until after graduation?  Is there any downside? 

I'm thinking I should grow a beard now, and study the Great Depression.

Thanks for your help,

"Little" Bobby Spankle, Starting Linebacker, TAU

Well, Little Bobby, I'm glad you asked, because I've just been "itching" to provide an update on the beard.  Ha!  Itching!  Get it?  That's just a warm-up into some of the first-class humor I'll be providing throughout this entire paragraph.

I'm sorry to make light of your serious question.  I know I'm the envy of every man right now, sharing a beard with Bernanke... but, not surprisingly, there is a dark side to this beard.  For example, many days I wake up with an almost-uncontrollable urge to print money.  Barely a week ago, I awakened from a fugue state to discover I'd printed almost 20 million dollars using only my inkjet. 

Luckily, I've been able to control these urges by plastering Ford-era W.I.N. buttons ("Whip Inflation Now!") all across my workspace.

But there are other side effects.  Yesterday, I tried to call my wife "Cutie-pie," but it kept coming out "QE-pie."  Try as I might, I couldn't say anything else, and I found myself repeating it uncontrollably: "Hi QE-pie. Hi QE-pie!"  I felt like Leonardo DeCaprio at the end of the movie The Aviator

I'm telling you this as a warning, because today I realized what the problem was.  Initially, I had kept the beard close-cropped and above the neckline -- but over the past couple weeks, I'd gotten lazy.  When I looked in the mirror today, I saw that the beard had expanded completely unchecked and grown to an alarming thickness, not unlike Michael Moore.  It was now reaching down across my neck, threatening to overtake my throat and choke the sense out of me.  I also discovered about eight gray hairs. 

Its tranformation was nearly complete.  The beard was trying to take over my face, and if I didn't act quickly, it would soon claim my soul.

I sprung, or possibly "sprang," into action.  After subduing the beard with a hot towel and a hammer, I was able to gain the upper hand long enough to use my electric razor to trim off half an inch "across the beard."  After that, its control was weakened enough that I was able to use my Gillette to shave off the entire portion beneath my jawline. Enough beard remained that I still ran out of the bathroom and handed each of my kids a hundred dollar bill... but the urge to print money was gone!

Later, as I rinsed out the sink, I heard what sounded like hundreds of tiny, high-pitched voices chanting.  They were progressively fading in volume as they washed down the drain -- but as I shut off the faucet, I was just barely able to make out their faint words as the last whiskers spiralled down: "Crush the dollar!"

Actually, Little Bobby, I just remembered: you want to be Fed Chairman!  Forget everything I wrote... the beard is perfect for you.

Market Update

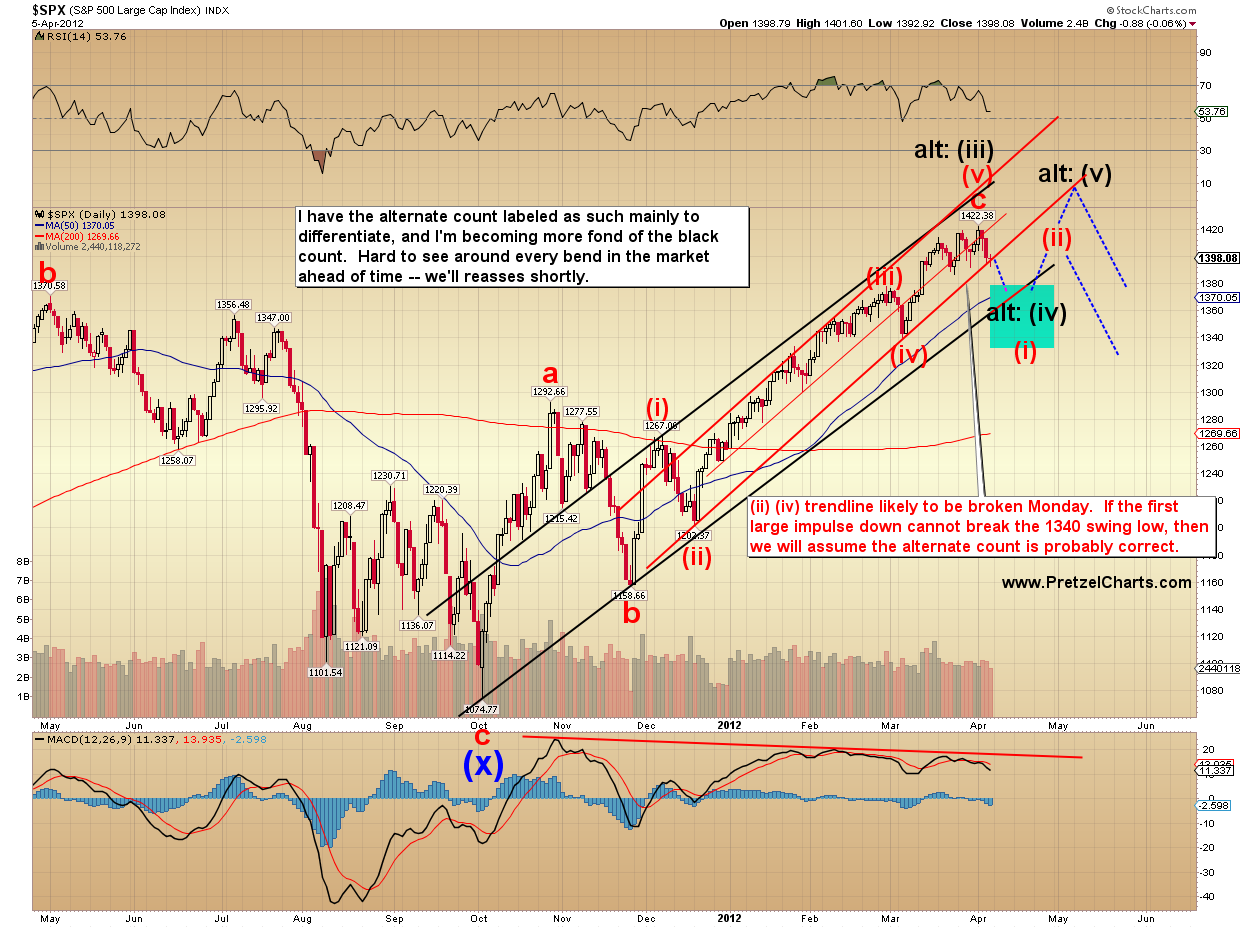
Moving onto the charts, the market has left a lot of potentials open, and I hope it doesn't get too confusing for readers.  I've spent literally the entire weekend trying to sort out one from the next, and I'm reasonably confident in both my short-term and longer term preferred counts. 

I have outlined the alternates because, despite all the time invested, there's never a guarantee that the preferred count's right.  And this is a game of inches right now -- so it's easy to see one or more alternate coming to town.

The possibility of an (x) wave, while purely speculative, gives me a bit of pause in simply declaring the correction over without further consideration.  I could go the straight line route and pretend it's not a possibility, but I've seen these things happen too many times after extended fifth waves to blissfully ignore the potential.  Nevertheless, I do consider the (x) wave to be the underdog here.

The correction did form a complete a-b-c, and that's all it was required to do.  Trying to predict an (x) wave is akin to trying to prove the existence of dark matter -- there's little evidence for it before hand (except possibly in real-time, which no longer fits the dark matter metaphor... quit being so literal!).

At this point, I'm favoring the view that the (x) wave will probably not materialize, but I think it pays to be aware of the potential, because then bears get double credit, income-wise -- and at the same time lower their risk profile.

Of course, no one wants to leave money on the table if this is now the fifth wave decline.

So, the best odds at this stage will probably come from watching the red downtrend line shown on the charts below.  If the market sustains trade above that trendline, then it becomes more likely that the (x) wave is in play, and will go on to make new highs for the correction.  Luckily, this means that even the most passive swing trader who went short at the 1384 rally target presented last week should be able to guarantee a profit.  More aggressive traders can find other ways to lock-in profit.

Long-time readers know that I try to assimilate as many factors as possible into my analysis, to help sort one count from another.  To this end, the timing of a fifth wave (instead of an (x) wave) seems to fit well into the seasonality. 

Below is an excerpt from my friend Lee Adler.  In his Wall Street Examiner Professional Edition, he analyzes -- among other things -- tax data and the moves of the Treasury:

The markets get a gift in the coming week. Depending on how strong tax receipts are, the Treasury will pay down as much as $48 billion in expiring short term bills on Thursday. That’s cash that will come back to holders of the paper. They’ll have to put it somewhere. This is a normal feature of tax week, and some of that cash usually flows toward stocks. Tax receipts are looking a little stronger than last year, so that the paydown is likely to be substantial even if it isn’t quite $48 billion. That should be enough to put a bid under stocks by Thursday if not before as the dealers and other holders begin to anticipate this cash hitting their accounts on Thursday.

Last year the S&P gained about 56 points in the 7 days following tax day.

This would fit the fifth wave count extremely well, as it is likely to bottom this week -- and from there the market seems likely to embark on the larger 2nd wave retracement rally to match the seasonality.

Of note, this seasonality does also fit the bigger picture alternate count of the larger wave (iv) bottom, so this is yet another reason for bears to be cautious.

After studying the charts this weekend, and giving consideration to as much additional data as I could, I am favoring the fifth wave decline over the (x) wave and wave (iv)   Do remain alert to those potentials, though -- because the market often does the unexpected despite our best efforts. 

The chart below shows the preferred count as represented by the blue lines.  The pink count is the short term alternate.  The gray count is the 2nd alternate. 

Also be aware that if the b-wave low isn't broken by this wave down, bulls could launch an even stronger counter-attack... in other words, something even more bullish than anything shown below -- such as the larger wave (v) rally discussed later.


If the market continues down strongly at Monday's open, then the pink count above may actually be the correct short-term interpretation.  The chart below shows why I'm favoring the blue count, but I'm almost equally split on the two.  I'm favoring the blue count by maybe a 5-10% margin.

If the blue count is correct, it's difficult to gauge how much, if any, downside is left to that wave.  It would look better with some kind of correction and a slight new low -- but if one counts all the little squiggles, then there's already enough for it to be complete.

I'm not sure exactly where to place the assumed wave (2) target, because I'm not certain if (1) has bottomed.  Expect (2) to retrace between 40-60% of (1).  If a snap-back rally materially exceeds the 62% retrace, then we may be facing one of the alternate counts.


Now let's back off a little, and examine the larger time frame, to see how the market could find support soon, to match my expectaton that this is the fifth and final wave of the decline before a larger correction.


Next are the RUT charts, both short and long-term.  The 5-minute RUT chart contains critical data I want to discuss in more detail. 

Many Elliotticians whose work I respect are labeling the decline as ALL OF wave (i) down.  But based on the RUT, that count doesn't work.  This chart reveals exactly why I do a lot of market cross-studies before deciding on a count (I don't mind revealing my "secret" -- because my secret is simply hours and hours of additional hard work each day.  Anybody can do it!  Though to be fair, I imagine it's more difficult for people who have day jobs.).

This is also why I've prepared the battery of longer-term charts to help illustrate why the markets could find support very soon (if they haven't already).

The preferred count is shown in blue on the chart below.  The short-term alternate is shown in pink -- and again I'm only marginally favoring the blue short-term count over this count.  The intermediate term alternate (of either (iv) or (x)) is shown in black.


Long-term support is also nearby on RUT.


NYA likewise demonstrates why it could find support soon.  We looked at this pattern a few articles ago.


Same goes for the Nasdaq Composite.


Of course, the market's not entirely predictable at all times, and the more bearish potential that most wavers are favoring can't be completely eliminated.  Based on the patterns in RUT and others, I view the super-bearish potential as significantly less likely, but not impossible.

There are pretty good-looking head and shoulders patterns forming in many markets... I suspect, however, that another bounce is needed before that pattern is fully complete.  The INDU chart below shows why -- as it sits right now, the right shoulder would be very narrow relative to the left shoulder.  And, as discussed, the more immediately bearish count doesn't fit the wave structures across markets nearly as well.

Still something to be aware of, though I would assign low probability to it.  The more bearish alternate count is in black.


And of course, the more bullish side of that coin looks like the alternate in the chart below.  I don't think I've missed a short-term call in a couple weeks, and I always get a little worried for my readers after a long winning streak, because it tends to breed complacency.  The market isn't "supposed" to be perfectly predictable, and eventually I'll miss some calls -- that's just how it goes, so please make sure you take precautions in order to be protected whenever the misses come.

There are two big picture alternates shown below.  The first is that wave (i) bottomed already (low probability, for reasons discussed), and the second is that wave (iv) bottomed.  The wave (iv) count is still quite high risk to bears.

As I said earlier, this is a game of inches right now -- in other words, it wouldn't even take a big miss to see an alternate potential play out.


Finally, since Apple is "the Economy" these days, it does appear that Apple may have finally put in a top of some significance.


I've also added a quick and dirty US Dollar chart.  A triangle breakout in the dollar might suggest some hope in the more bearish equities counts -- if it occurs with conviction.  If the dollar can put together a strong rally, then that's likely to cap any equities rallies.  Of course, it has not broken out yet, and can always form another leg down before a breakout.  Or not breakout at all.  We'll factor this into the equities analysis if and when it occurs.

I've labeled the chart with a potential wave count, but my confidence in this count is marginal.


In conclusion, it does appear reasonably likely that there's one more decline to at least marginal new lows below 1357 still coming.  Again, the first SPX chart, and the first RUT chart show the preferred count in blue. 

With the short-term counts, I'm trying to sort fly droppings from pepper here, so it's probably more important to focus on the bigger picture than the 1-minute "is this (3) of 5, or (1) of 5?" charts I've presented alongside it.  I'm simply trying to help readers maximize their awareness and earnings. 

Looking at the big picture, one can see I'm not currently part of the mega-bearish camp that believes we're entering a larger third wave down.  I think this wave is close to a bottom, assuming of course that it didn't bottom at 1357.  Depending on the structure laid out by the market in the next few sessions, of course, my outlook may change.

As of this moment, however, I believe bears should exercise caution, because the assumption is that this will be the final decline before a larger snap-back rally.  The (x) wave adds confusion to the potentials, and should definitely be watched carefully.  The key levels to watch are the red trendlines, and the recent highs on SPX and RUT.  If the market makes it back above those levels, shorts should probably get out of the way for the time being -- especially with the possibility of the big picture alternate count taking us up to new highs in a larger wave (v).

But if the overall view is correct, there should be another 20-40 points of downside left on the SPX first.   Trade safe.

Friday, April 13, 2012

SPX and RUT Update: Warnings that the Market Outlook May Be Changing

Yesterday the market reached the 1384 upside target  -- and it also ruled out some possibilities, which is actually quite helpful.  In fact, yesterday's charts are chock-full of new information I didn't have before -- so this has changed my outlook somewhat. 

I believe it's very important to assimilate new information from the market, and to allow yourself to be influenced by that information.  You have to be ready to turn on a dime, and the market rewards traders who are nimble and punishes those who aren't.

Prior to yesterday, RUT had an appearance that could be interpretted a number of different ways.  It has now clarified itself as an extended fifth wave.  Prior to yesterday, there was simply no way of knowing this with any certainty.

There are a number of possible outlook changes as a result of yesterday's action, and I'll try to cover those changes, along with some signals to watch for.

Readers will recall that my alternate short-term count for SPX was an extended fifth wave.  As a result of the RUT's action yesterday (and some other things), I've made this extended fifth the preferred count.  Readers would be wise to take heed of this possibility, because it does alter the expectations of what would usually happen next.

Let's start with RUT, and from there I'll cover the changes in more detail.  We'll also look at more bullish outcomes, because the market has declared that we should.

Note the blue lines on the chart, which is a rough representation of how things might go if the bear count is still in play -- more on that later.  It is exceptionally difficult to anticipate all the ins-and-outs of this kind of retracement with high accuracy from this position, so this is a best-guess rough guideline of what could happen.  This guideline will get more accurate over the coming sessions.


One of the other things I want to discuss regarding the above chart is this:  it bothers me more than a little (for the bear count) that, if not for the extended fifth wave, there would have been an almost-perfect c = a relationship between the two waves of the decline.  This might be an early-warning clue to the market's intentions, and until the market confirms an impulse in the downward direction (by making a new low), bears might consider being quick to take profits -- or at the very least: cautious in protecting them.  I know that I will be.

Anyone who went short near yesterday's target high of 1384 SPX should, at worst, be able to make a quick, small profit, or at least limit their risk substantially.  This illustrates the importance of having the patience to make proper entries, and of not jumping into the market at random.

Readers will recall the big picture alternate count that this decline was a larger wave (iv).  Closer to the top, I was somewhat fond of that count -- but after the strength of the decline, I became less fond of it. 

I think we have to go back to giving that count some very heavy weight for the time being, until the market more clearly reveals its intentions.  I'll discuss why in a moment, along with what I'll be watching -- but first, here's the refresher chart for that count:


There are several warning signs which have cropped up with yesterday's action -- enough signs that, at this exact moment, I am giving a lot of consideration to making the more bullish count into the preferred count.  The next session or two should give us some early indications to decide which outcome is more probable.

Let's take a look at the short-term SPX chart, which highlights the bear count(s), and then discuss what to watch for.  This is currently the preferred count.


Here are two things to watch:

1.  If the current wave declines a little bit, say to 1381-83 (which would be the first target for a bullish correction) or lower, then makes a new high before it overlaps 1374.71, then that will make the rally a 5-wave impulse.  This will be a strong warning that the bullish count could be in effect, and new highs become more likely.

2.  The inverse is true: if the SPX overlaps 1374.71 first, then it virtually "locks in" an a-b-c rally, which would suggest new lows are more likely.

So we'll watch and wait right here to see what happens next.  Neither of these things guarantees a bullish or bearish resolution, but they do make each resolution signifcantly more, or less, likely.

I'm going to wait for the market to give its answer, but it won't take much here for me to make the bullish count the preferred count.  There are a number of reasons for this, including this NDX chart (below).  Note that all the targets published on 4/2 were reached.


And then there's this NYA chart.  The NYA chart is labeled with the bullish count... because that's what fits best.


Readers will also recall that my target for a bottom in the more bullish count was SPX 1350-1356, as shown on the chart discussed in this article, published on April 8.  SPX's low was 1357 -- close enough.  While you're there, take a look at the RUT chart in that article and its targets for the bull count, which were also reached perfectly. 

Same goes for the Wilshire 5000 (WLSH).  In fact, let me bring that chart forward, completely unchanged except for the new price action.  Back on April 8, I drew in a "hypothetical channel" based on the shape of the rally -- look how well that "guess-timate" channel held up.


Other factors bears should consider: yesterday had strong breadth and market internals; and was also a strong accumulation day, which rarely happens at the exact high of a move.

For an example of what the bull count might look like over the short term, here's a look at how things could play out in the RUT for that count.  Expectations would be similar for SPX.


In conclusion, after examing all this new information (and trying to be as objective as possible), I've practically talked myself into making the bullish count the preferred count.  As I said earlier, though, let's give the market another session or two to give us just a little more to work from before we completely throw out the short term bear view.  There are several key signals to watch right here.

Even if the bear view is correct -- based on the expectations of an extended fifth wave retracement, a new high is the likely outcome before new lows. 

With the new info received from the market yesterday, I think bears need to stay very cautious and alert at this juncture.  Trade safe.

Thursday, April 12, 2012

SPX Update: Looks About Right So Far...

Tuesday held no surprises as the market did a ramp and camp, which fits the terms of the technical bounce discussed yesterday.

Toward the close, I wrestled a bit with the wave structure, but in the end decided it appeared a little more likely that the rally would carry forward in at least one more leg.  It does remain plausible that the fourth wave completed yesterday as part of an expanded flat, but that's the alternate count.  I don't think it's entirely clear-cut, and I would say I'm split maybe 60/40 on the odds between the two short term counts.  Any print above yesterday's high would rule out this alternate. 

The short term SPX chart is below.  Theres been no material change in this chart since yesterday, but we now have a more accurate "perfect world" target for wave c of 4, at 1384.  Support/resistance levels are shown in black, and the rally stopped right at 1375 resistance yesterday.

If for some reason the rally can't make it back up to the blue target box (it doesn't have to get there tomorrow -- I'm speaking more in general), then that would (obviously) be bearish and could indicate that this count is too conservative.  Yesterday's "aesthetic chart" covers that possibility in more detail, but I'll worry about that more only if I need to.


The larger degree alternate count (black) shown above considers the possibility that wave (i) has bottomed.  Bears want to remain cautious if the bounce is stronger than expected, as possible warning that one of the alternate counts may be unfolding.  Ideally, if this is a fourth wave, it should not sustain trade above 1388. 

What bothers me a little bit for the preferred view is the huge gap from 1398.  This gives the bulls, and the market makers, something to aim for -- so do remain aware of the larger second wave potential, and if momentum seems to be increasing and 1388 can't contain, then bears may want to hold onto their wallets until 1398 or so. 

We're also still watching the big picture alternate count (below).  On the upside, 1398-1400 is currently the level to watch for clues about this possibility.  Closes north of 1398 would be bullish; conversely, a clean rejection at that level could kick off the next big drop.


A few of the reasons I'm not currently favoring the big picture alternate count are shown below.  NYA and INDU look particularly weak, and have both broken their March lows.


In conclusion, yesterday's bounce was as expected, and another leg up of roughly equal length would fit the terms of the preferred count.  After we have some more solid indication of where the assumed wave 4 has topped, we'll calculate some targets for the next wave down.  In the meantime, there are several levels for bears to watch which could give warning that one of the alternate counts was in play.  Trade safe.

Wednesday, April 11, 2012

SPX, CVX, and NYA Updates: Aesthetics vs. Technicals

Yesterday's market blew through the downside projections, much like the rally did on the upside earlier this year.  It comes to mind that the prior rally became historically over-extended, so there are a lot of folks ready to jam the exit doors, and it shouldn't be surprising to see the same types of extensions happen on the downside... if the trend has indeed changed -- which I continue to believe it has. 

I believe we are in the very early phase of a major trend change.  While there is an alternate count that allows for another wave up, I view that as less-likely by the day.  The market looks very weak right now... but we will continue to be on alert for the alternate until it drops below 25% probability, especially since SPX has not broken through 1340 yet. 

Many indicators have reached oversold readings, and there are divergences on the smaller time frames, so some type of relief rally may be in order here.  The shape of this rally will tell us a lot about what's to follow.

Below is the short term SPX chart, which shows the conservative labeling, and corresponding bounce targets, for this decline.


That's the conservative, "everything's oversold -- be cautious" chart, and there are good reasons for bear caution.  As an indicator of just how oversold, below is the McClellan Oscillator, which is generally one of the more reliable indicators out there.


RSI and MACD are arguing that the bounce can be sold.  There are divergences in the short time frames, but not in the larger time frames.  The larger time frames have "confirmed" the low -- meaning the indicators reached new lows along with price.  The majority of the time, this means that lower lows are still coming. 

The charts above show the conservative arguments as to why a bottom is near (likely after the next low).  But when I step back and examine this decline from an aesthetic perspective, I see the more aggressive pattern below as a distinct potential.  I'm not advocating throwing caution to the wind, by any means.  Examined technically, the odds are against this more bearish pattern.  The pattern below is more of an aesthetic thing -- and sometimes that works, sometimes it doesn't. 

If the bounce overlaps 1378.24, then we can take this count off the table and focus on the first chart.


Next is a non-Elliott look at the potential broadening top/megaphone that's formed in NYA.  It also shows that NYA has now overlapped the October highs, and broken the March lows.  Both of these developments are intermediate-term bearish.


Next is an update on CVX, which has reached its 101 +/- target, which always means time to take some profits, and time to start watching for a bounce.  This trade was an out-and-out winner, and I hope some readers were able to profit from my sell recommendation when CVX was trading at 110/111. 

It appears probable that there's some more downside still in store, but of course there's no guarantee.


In conclusion, the odds favor the next bounce as being a good sell opportunity.  How solid the bounce is will give us some indications of how far the decline may have yet to run, if indeed it does.  Trade safe.

Tuesday, April 10, 2012

SPX Update: A (Bearish) Look Out Across Several Markets

On Sunday, we played devil's advocate a bit and tried to tear down the preferred count.  We'll continue watching the alternate possibility presented there, but we're going to focus on the preferred count until the market suggests we shouldn't.

The preferred count continues to believe that the market is in the early stages of an important trend change, and I've assembled some additional supporting evidence in favor of this view.  The first chart I'd like to present is the London FTSE, which has now overlapped its potential first wave.  While this doesn't rule out higher prices in the future, it does substantially lower the odds on any long-term bull counts.


Next is the German DAX, which also looks bearish.  It appears that the preferred count for DAX, presented a couple times over the past month, did a good job anticipating the turn in that index.


Silver appears to be breaking down from its uptrend.


Next a look at several indices on the same chart.  NYA, WLSH, TRAN, and INDU have now all whipsawed their recent key breakouts.


Let's take a quick look at the preferred count in the big picture view.  Keep in mind that the next bottom (blue target box) could mark ALL OF wave (i), or only mark the bottom of wave 3.


The same count, shown on the 5-minute chart below.  Trade above 1392.92 would eliminate the 4th wave interpretation and indicate that a correction at higher degree was unfolding.


Finally, a look at the alternate count at next highest degree.  The first target under the terms of this count was reached yesterday.  The 2nd target below might line up with the black count shown in the chart above -- however, the market is reaching into territory where bears need to be very cautious of a larger rally developing.  If the first target below is exceeded, and the second target missed, that might argue a bit in favor of the preferred count.


In conclusion, there are even more bearish signals appearing across markets, adding some degree of confidence to the preferred count.  Unless bulls can pull a major stick save here (wouldn't be the first time), it appears that a larger trend change is beginning.  Trade safe.

Sunday, April 8, 2012

SPX, RUT, CVX, WLSH Updates: Last Update Was the Bear View; Now Let's Poke Holes in It

In Thursday's update, I built up the bear case; for today's update, we're going to try to poke some holes in it -- and within all that, we'll look at some targets which fit both.

Since I covered the bear case in quite a bit of detail on Thursday, today I'm going to spend the majority of the article focussing on the alternate count and the merits therein.

It is simply not possible to see out around every bend in the market ahead of time, so the approach I take is to try to anticipate potential patterns before they occur, and then see how the market responds to validate or invalidate those potentials.  This alternate count is one of those attempts, and I think it's a very viable possibility.

The first key to remember is that tops are not supposed to be recognizable until after they've passed.  They are supposed to trap a lot of buyers on the wrong side, and they're supposed to blow out a lot of bears in the process (by whipsawing them) -- so that there's fuel for the first round of selling.  Some level of ambiguity is to be expected here. 

I've personally always found important bottoms to be relatively easy to call, at least the majority of the time -- but major tops are usually confusing places where the market becomes a bit schizophrenic and throws off a lot of false signals in both directions.  As we examine the charts today, we can see some of those signals present. 

I'm going to lead with the Wilshire 5000 chart to illustrate what I'm talking about.  Long-time readers will immediately notice that this count looks a bit weird.  It considers the option that wave 1 of (iii) was the extended wave, and the annotations explain the merits of this interpretation.  I really like how it lines up all the 2-4 trendlines present throughout the first wave. 

This chart took a long time, with liberal usage of the "delete" key, but it still remains the alternate count for now.


Let's continue running with the alternate count for a moment and look at some of the targets for SPX under the terms of that count.  The middle target of a 2.618 extension currently appears the most probable, but we'll have to re-examine as the wave unfolds. 


Here's what the alternate count would look like for the bigger picture.  I like that it would create a better-looking major top pattern and blow out all the bears who join the fray too late.  Note that the alternate count is not long-term bullish, it simply suggests a new high to complete the pattern.


RUT is giving similar targets for the alternate count.  RUT has also cracked its major uptrend line, which isn't bullish -- but it's not unusual for one to see this happen a few times as an early warning signal before the final top hits.


Let's throw this next chart into the mix, where my somewhat recently-discovered red cycle predicts a low near April 23, plus or minus a few days.  This could fit the terms of either count quite well.


So those are some of the things I'm watching here.  The final top may be in, but there are still an appropriate number of question marks surrounding that conclusion.  Next, let's look at the preferred count in more detail.

The first chart is a simple analog, and shows that RUT may be building a similar fractal to its last major top.


The next chart shows the SPX short-term targets, which work under the terms of either count.  It's possible that Monday's decline will mark the fifth wave of the total decline (black), but I view it as quite a bit more probable that it is actually wave (3) of 3 (blue).  1380 is the first target under the blue count, 1360 is the second.  The chart talks about watching momentum for confirmation.

The target of 1350 shown earlier as the alternate count 2.618 extension would work quite well with the short-term interpretation, which is reading this as a nest of 1's and 2's.  Because there were no violations of the previous 1 and 2, an extended fifth wave is also valid.  The final target for an extended fifth would be 1342-1345.   


Finally, an update on CVX.  There are two ways to look at CVX here -- there's the hard math conservative way, which says a bottom is close.  Then there's the gut instinct way (my approach), based on experience.  I'm going to show both views here, but conservative traders may want to opt for the conservative approach and take profits more quickly.  Until I see the market open, there's literally nothing backing my read but my gut.  

CVX has been a big hit overall, and the trade is already about 6% in profit since I first called attention to it on March 18 -- so there's no need to get overly greedy... but at the same time, one never wants to leave a bunch of money on the table.  I haven't called a bottom in CVX yet because I haven't seen one. 

If CVX opens Monday down significantly and momentum confirms, then it's likely that my "gut instinct" view is correct and the question becomes whether to take profits near 101 or simply move stops and push for the lower target.  If CVX is showing divergences in momentum on the open, then one may wish to opt for the very conservative "wave 5 almost over" approach and take profits quicker.

There is also an even more bearish interpretation which says that 3 and 4 are another 1 and 2.  We'll reassess this chart as needed.


In conclusion, referring back to the larger view of the market, there are two main possibilities, both quite viable.  There are bearish signals across other markets, which may indicate the market made a long-term top -- but there is enough ambiguity to give me quite a bit of pause, and I feel it's prudent to let the market dictate further before trying to draw definite conclusions.

As I expressed heading into Thursday's close, both short-term patterns expect lower prices directly.  The 1350 +/- zone currently seems to be a pretty good final target for both counts, but traders should definitely exercise good trade management until the pattern unfolds a bit further and allows more accurate targeting.  We'll reassess all this as the move develops.  Trade safe.