So, it seems I was indeed "due" for a screw up, and I got that one wrong.
That said, I do want to note that I never backtracked from my piece on November 8, when I wrote:
In conclusion, there's no quick and easy roadmap in the current position, so we'll just have to watch for potential impulsive declines in real-time and take it from there. Waiting for impulsive turns can sometimes help bears stay out of trouble in the event the "straightforward bull count" shows up, since that approach prevents one from shorting the entire ride up to new highs. It also gives one a clear stop (against the high where the (pending) first impulse down began), as opposed to the current situation, where the only crystal-clear level is way up at 4607.
Any bears who followed that "not trading advice" haven't lost a dime on this rally yet, so I hope it helped someone. I'm at least glad I published that when I did -- and even last update concluded by reminding bears that while I was leaning their way from an analytical standpoint, I wouldn't bet the farm on that, because, quote: "we don't even have an impulse down yet!"
Anyway, now we get to try to figure out what the market is actually trying to do here.
The simple answer, if you're a bull, is "run to the moon." If you're a bear, then it's the opposite. And while either of those stances is easy to say for the "perma" crowd, supporting them is the rub.
Let's start with the bull argument, which is tied to the news that became the excuse for the rally: The CPI report was released yesterday, and core inflation rose a bit less than analysts expected (they expected .3% over September, but it rose .2% instead). This, in turn, leads to the hope that inflation will continue moderating (it's a bit confusing/misleading when analysts say inflation is "falling" -- inflation is still increasing month-over-month, just not as quickly as it was before), which in turn leads to the hope that the Fed will stop raising rates, which in turn would take some pressure off the market and the economy, and maybe forestall a recession.
Core Inflation came in at 4% (in September, it was 4.1%); the Fed's target for Core Inflation is 2%. Thus, the bull argument is partially predicated on the belief that Core Inflation will continue moderating until it reaches the Fed target of 2%, prompting the Fed to declare victory and go home.
Overall inflation, which is the rate at which your overalls expand during the holidays, was 3.7% in September, but came in at 3.2% for October, largely because people ate less due to an increase in the price of food, thanks to inflation. Wait. [consults notes...] That's only partially correct (I trust my readers are smart enough to figure out which part!).
Now, the hope for bulls here is that the Fed will see all this and decide that all the numbers are headed in the right direction and thus that they no longer need to raise rates.
But here's the thing: Given the speed of this rally, bulls also seem to be hoping that the Fed will then relaunch QE while consumer debt simultaneously vanishes overnight (thus giving people a whole new clean slate of spending power) and the market will head right back into a significant bubble. Because...
(and this leads us into the bear argument)
...as we've discussed here previously, P/E ratios are not "low" by any means. To the contrary, the current P/E of SPX is now hovering near 25, which is already into "overvalued" territory.

For comparison, in October, 2007, at the peak just before the biggest bear market in recent history, the P/E ratio was 23.41.
Can an overvalued market get even more overvalued? Absolutely. We've seen it happen many, many times in the modern era of centrally-managed currency and interest rates. But that doesn't change the fact that the current market is not exactly a fundamentally good value.
No one is buying here because prices are low. Prices aren't low, so they're not scooping up great values in solid, beaten-down stocks.
They're buying because they're afraid that other people are going to buy before they do.
And, whether they know it consciously or not, one could argue that buyers are not only banking on the Fed ceasing their campaign of raising rates, but on the Fed cutting rates fairly quickly and probably stimulating the market again. Because P/Es rarely get much above current levels without either a bubble or a crash (in the case of trailing P/Es, where prices drop rapidly to make past earnings seem massive by comparison).
And hey, maybe that bubble will happen. Wouldn't be the first time. But that's at least part of the bear argument.
Let's take a look at oil. So far, oil is bouncing off its downside inflection zone (usually my identified inflection zones work, unlike SPX yesterday!). Equities bulls probably need to also be oil bears (since bullish oil drives inflation higher), and oil bears probably need to see a sustained breakdown at the rising blue line, for starters -- though I haven't updated the annotation since the prior warning, since I literally can't fit anything else on this chart without deleting something, and that seems unnecessary right now.

Next, let's look at COMPQ, which outlines the most obvious bull option. The most obvious bull option is a simple straightforward fifth wave to new highs currently underway. This would jive (for a reasonable bull case, that is) with what we're seeing from a fundamental standpoint, suggesting that even if COMPQ makes a new all-time high, it's not the start of a big new bull market, it's the end of one. Of course, that's the most bearish interpretation of the bull count, but also the one that requires the least speculation.
COMPQ seems to be heading toward the "or (2)," which I placed on the chart on October 26, but now regret not discussing in more detail at the time. While I make every effort to remain as objective as possible, I'm human too and am not magically immune from getting swept in by the prevailing sentiment, though I suppose I should see if it even reaches that before browbeating myself too much.

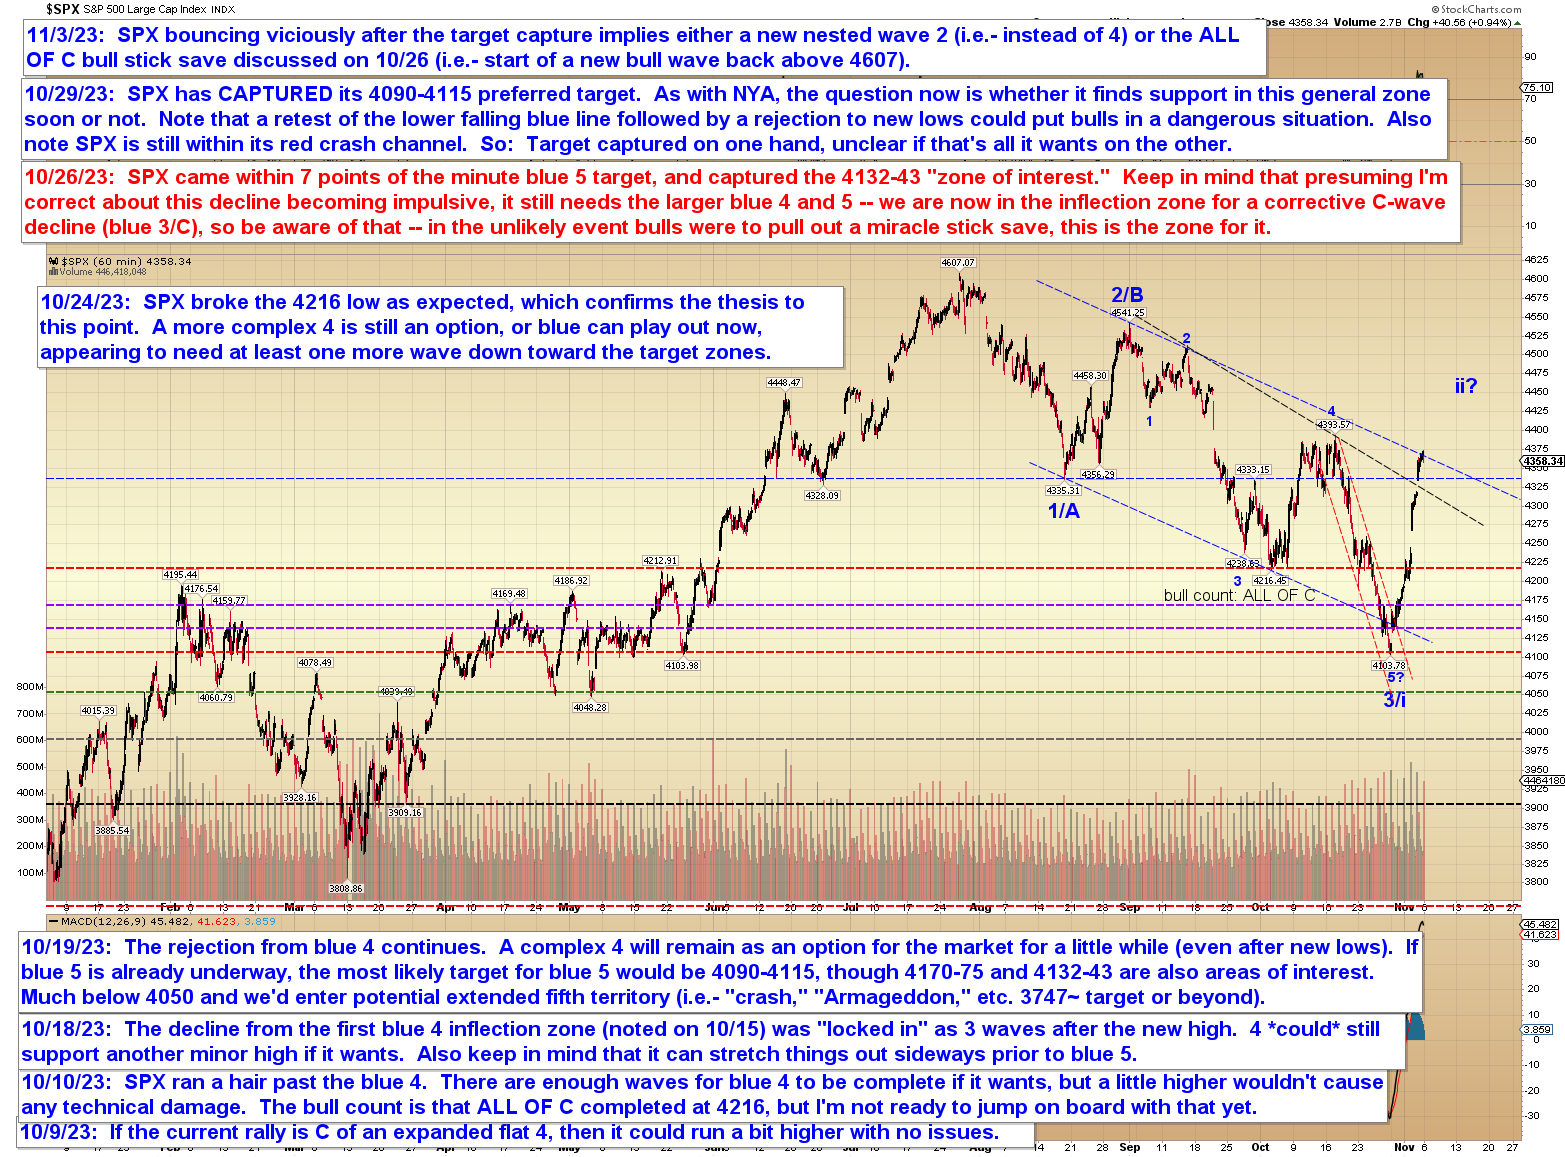
For SPX, we're just going to look at a simple chart for now. For the past week-plus, I felt confident enough that the market was headed higher to publish the chart with blue ii/4 overhead (above then-current prices), but now that we've passed that zone, we're into a sort of no-man's land as far as I'm concerned. So I'm not going to publish a chart that suggests we're headed to X zone next, because I just don't have that read to offer right now.

In conclusion, there are still bear options here, but obviously, bears will need to show they have even a little firepower to stop this thing for more than 10 minutes, and thus bears should still continue to await an impulsive decline before stepping in front of this steam train (not trading advice). On the bull side, nothing has changed from November 8, when I wrote that their count was straightforward, that is: "ALL OF C completed at 4103 SPX and it's on to new highs (north of 4607)."
Trade safe.