Amazon

Friday, May 22, 2020

SPX and NYA: No Material Change


Last update noted that the market had reached an inflection zone, and it's gone sideways since then, so there's no real change, but a couple zones to watch.

SPX reacted to two of the lines on Wednesday's chart:


NYA moved sideways/up, but it's still below the Red 1 high.


Beyond that, not much to add since Wednesday's update.  The first zone bears need to claim and hold is clearly ~2937ish.  If they can do that, then they probably get a trip to the blue line.  If they can then sustain a breakdown of ~2900, they probably get a trip to the black line.  First things first, though, and none of that happens if they can't sustain a breakdown of the first support zone.  Trade safe.

Wednesday, May 20, 2020

SPX and NYA: Inflection Zone


Last Friday noted that first downside targets had been captured, and SPX (at least) has since rallied up to a new high.  NYA has not yet reached a new high, but did rally up right to the "or 2/B?" label that I'd placed on the chart.  And you know what that means.

That means we've reached an inflection zone.

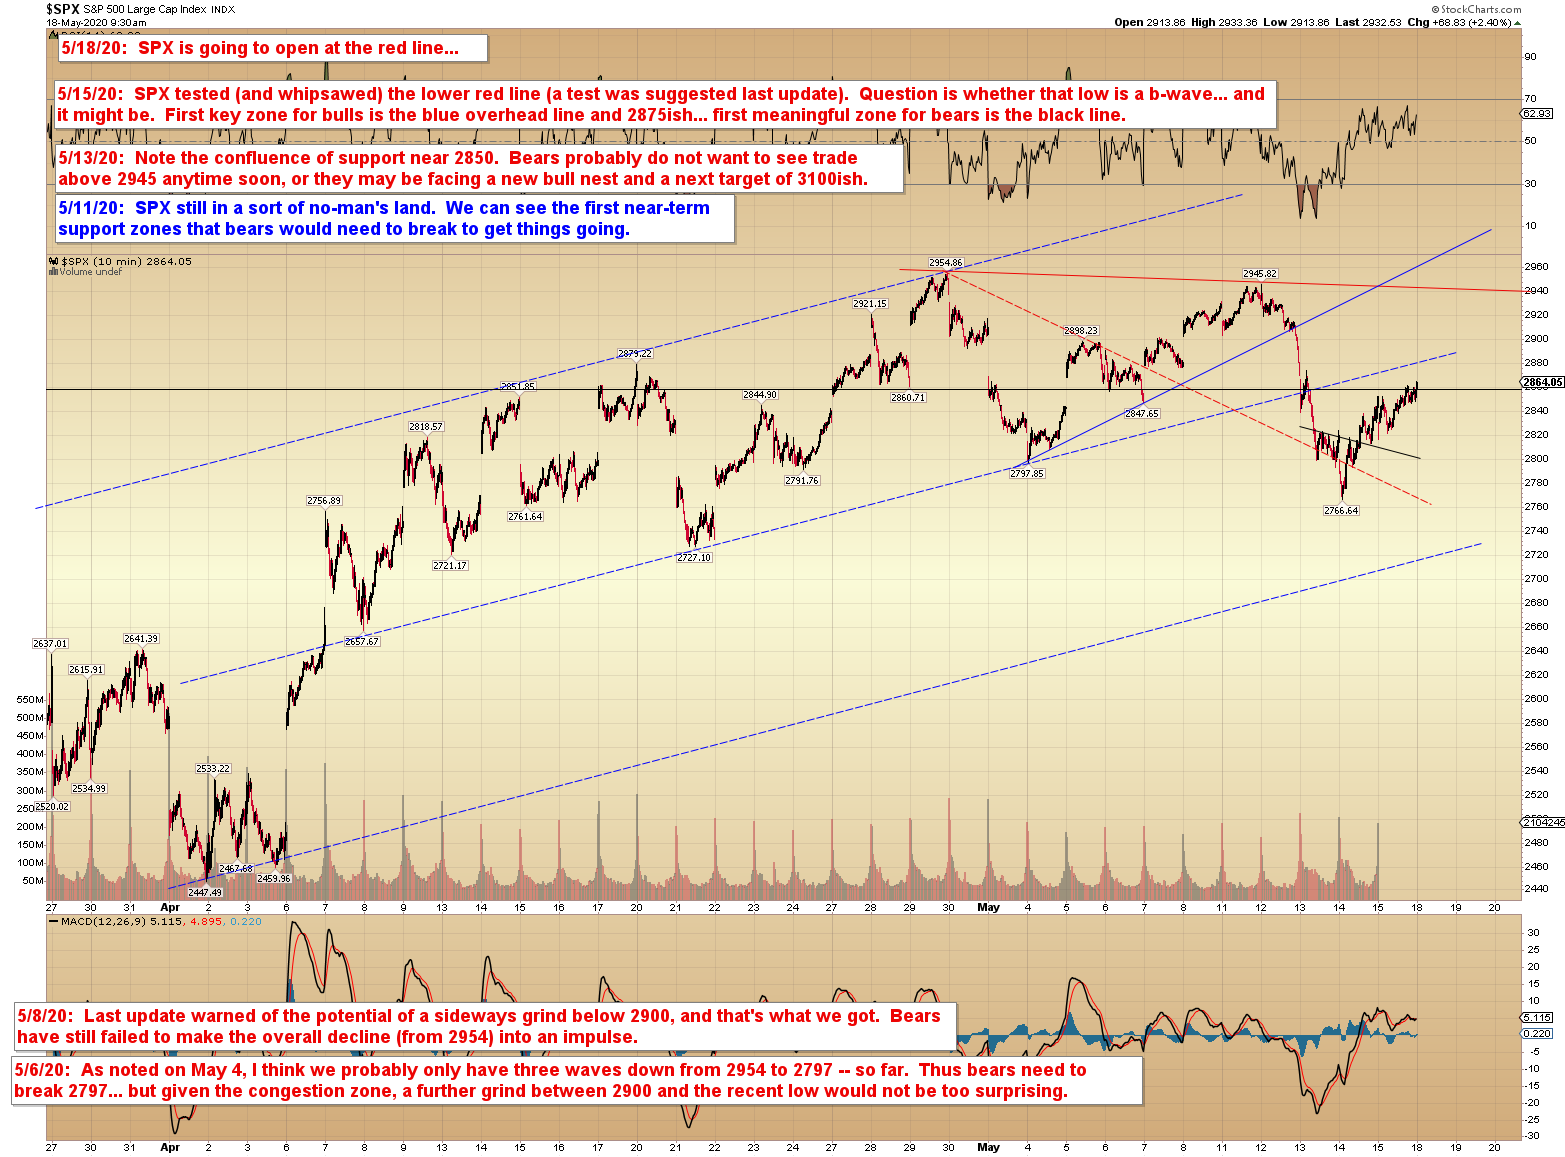
We'll start with SPX (because I think I wrote a more descriptive annotation for SPX), and we'll return to NYA in a moment.

(Note chart typo:  "2988-3000" should be "2968-3000"-- 2968 being this week's high)


So we can see SPX has three up from 2766.  NYA has three up from 10,551.  Both can run a little bit higher and remain within the inflection zone, but if the market want to opt for the complex flat, they do not need to run any higher.


In conclusion, virtually every market I looked at last night appears to be three waves up from its most recent swing low.  This means that:

1.  If they are going to form impulse waves, they still need AT LEAST one more decent new high to complete a fifth wave (SPX would probably at least want to tag the zone near the solid blue line overhead).
2.  If they are going to form complex 3-3-5 flats, then they could stall fairly directly and head back below last week's low.

Thus, this is an inflection zone -- but a rather unpredictable one, as there's just no way for anyone to know if the market wants to form a complex flat until it gives some signals of such.  The first signal to watch on both markets would be a sustained breakdown of their black uptrend lines.  Trade safe.

Monday, May 18, 2020

SPX and NYA: No Material Change


Last update noted that the downside targets had been captured, but that there was a slim chance the low was a b-wave.  Today's open will run close to the "or 2/B?" on the chart below.  The zone near the prior 2/B high (plus or minus) will be the inflection.  (Note that the fact that the market has/is rallying toward the "or 2/B?" does not add any confidence to that option, because it would rally that far if the ABC were to be complete at last week's low.)


SPX continues to rally from its three down (ABC) inflection as well:


In conclusion, no material change.  Potential three down identified last week seems to be holding.  Bears will have another shot as we approach prior highs, but if they can't get anything done there, then they may need to go back into "watch and wait" mode while bulls run with the ball.  Trade safe.

Friday, May 15, 2020

SPX and NYA: First Downside Targets Captured


Since last update, NYA gave a perfect tag of its red trend line (the first downside target):


SPX first downside target was the red dashed line, which it captured and exceeded:


The question now is whether yesterday's low is "it," and it could be... but I would say it's at least 50/50 on the potential of that low being a b-wave (meaning it would need to be tested/broken).  We'll be watching the first key levels as noted above for additional clues to hopefully help add confidence one way or the other (I'm very slightly leaning toward it being a b-wave low, but, as noted, it's close to being a toss up).  Trade safe.

Wednesday, May 13, 2020

SPX and NYA: Cloudy with a Chance of Powell

Last update noted that:

I can already say that if we gap lower this morning, Friday's high is going to at least have potential to be a b-wave high (which would mean it's an unresolved high and would need to be exceeded).

And that's exactly what happened.  After gapping lower, then rallying back up to break the presumed B-wave high, SPX reversed lower again.  It will be testing its first support zone today, near 2850.  Bears need to sustain a breakdown there (whipsaws (brief breaks of key levels that reverse directly) are often near-term bullish).  If they can maintain a breakdown, that would likely take them to test the lower red line next.  If they can't, then bulls might use that zone as a springboard.

(note: typo... "trae" = "trade")


NYA looks a little more straightforward than SPX.  At first glance, it looks like an ABC rally... but I'm not entirely able to rule out that rally as an impulse (hence the black bull count) and bears would thus like to see a sustained break of 10,900.


In conclusion, the jury is still out on where the near-term count sits, so I've shown the two competing options via NYA.  Today will hopefully answer which option is more likely.  Trade safe.

Monday, May 11, 2020

SPX Update: Scrapped!

I wrote a really lengthy piece this weekend, but it was a bit dark... so I scrapped it, because who needs dark in these bright times?  I mean, I didn't "scrap" it as in delete it permanently, I still have it and maybe I'll publish it one of these days.  But not today.

So instead we're just going to stay with the "short and sweet" theme of the past couple updates and look at one near-term chart:


In conclusion, there still isn't much to add, as the market remains in a near-term no-man's-land for the moment.  We can see the first zones bears would need to claim to get anything going, but I can already say that if we gap lower this morning, Friday's high is going to at least have potential to be a b-wave high (which would mean it's an unresolved high and would need to be exceeded).  To help rule that out, we would need to see the pattern develop into more than a single impulsive decline, or see bears break 2876ish.  Trade safe.

Friday, May 8, 2020

SPX Update: No Change


On Monday, I noted (on the first chart):

"So far, the decline is still three waves (and will be even if we open a bit lower today).  Bears need to create an impulsive decline to help confirm the presumed near-term trend change." 

Then on Wednesday, I reiterated:

...this decline is still three waves from the high, which means the market has kept its options open for the time being. 

And nothing has really changed.  So: short and sweet update today.


In conclusion, there's no real change since Monday, other than to reiterate that SPX is approaching potential resistance at the 2910-15 zone (which is a zone I've noted on the forum several times), so there may be some reaction to that zone. Beyond that, this remains something of a no-man's land, at least for the near-term.  Big picture, the preferred count continues to believe that Wave 4 bottomed at the March low and that the market is currently in a fifth wave to new all-time highs.  Trade safe.

Wednesday, May 6, 2020

SPX Update: No Material Change


Note: Sorry for the late update today... I was almost done, but then got stuck managing my own trades at the open and couldn't quite get finished with the update (it was a pretty active open, for anyone who wasn't around to witness it this morning).

Last update noted that the decline was three waves down from the 2950 zone, and "would remain so even if the market opens lower today."  The market did open lower on that day, and then bounced almost immediately, to the tune of 100 SPX points.  This means that this decline is still three waves from the high, which means the market has kept its options open for the time being.

On the near-term trend line chart, SPX bounced back out of the previously-noted red congestion zone, then back-tested it yesterday.  The black line below that, currently near 2830ish, looks like important support.  If bears can manage a sustained breakdown there (and then, of course, at the critical low of 2797), then that could take us toward 2740-60.


Here's another way to look at the near term; the blue channel is pretty well-defined:


In conclusion, there's no change to the big picture, and the battle lines have been drawn for the near-term: Bears need a break of Monday's low to confirm an impulsive turn.  Trade safe.