Amazon

Tuesday, January 18, 2022

SPX Update: 100% on the Year

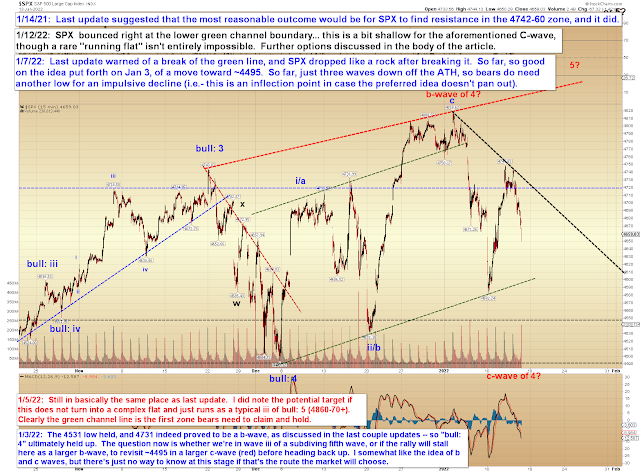
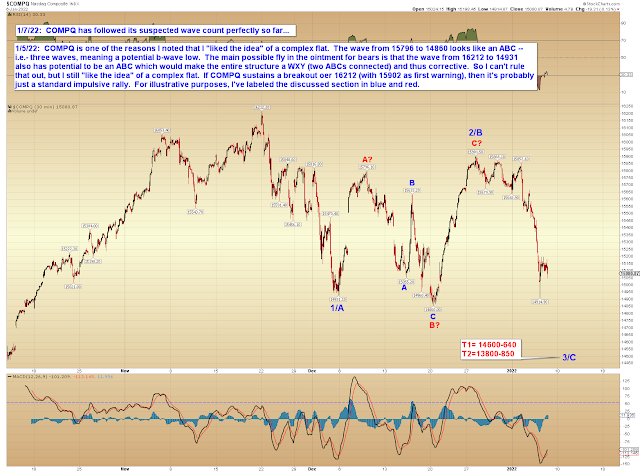
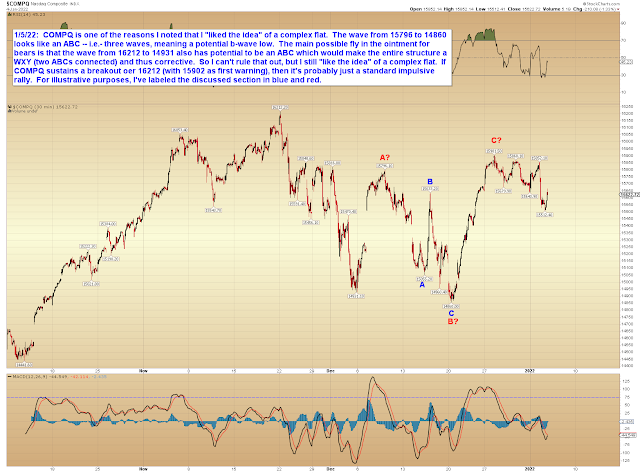
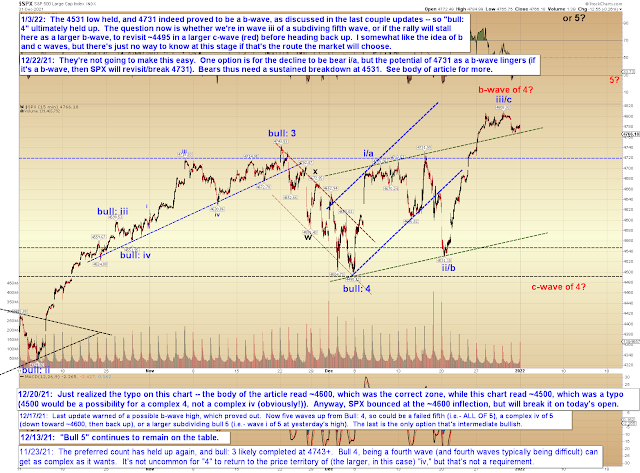
On January 3, I mentioned that I liked the idea of a nearly-immediate top, which would then lead to a c-wave decline below ~4495 -- and while that probably seemed a little crazy at the time, it doesn't seem so crazy anymore, as (at the time of this writing), futures are down at total of about 270 points from the January 4 high, getting very close to the ~4495 target zone.

More recently, the last two updates discussed the near-term count I was leaning toward, as follows:

The low is a micro b-wave, which could run toward SPX 4742-60 in a micro c-wave, before reversing back to break Monday's low [4582].

And this lean, too, was a hit, as SPX broke "Monday's low" of 4592 during yesterday's session.

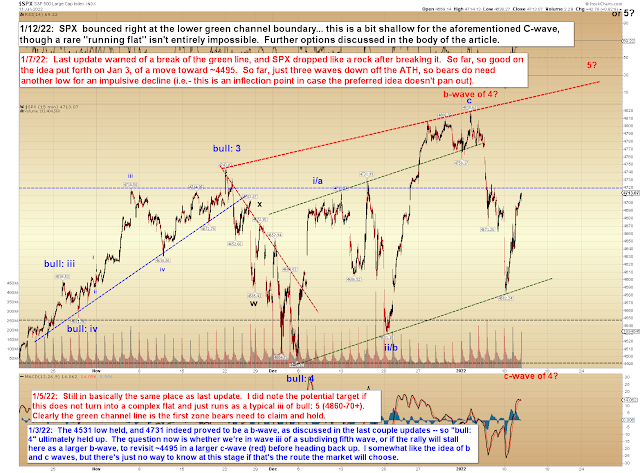
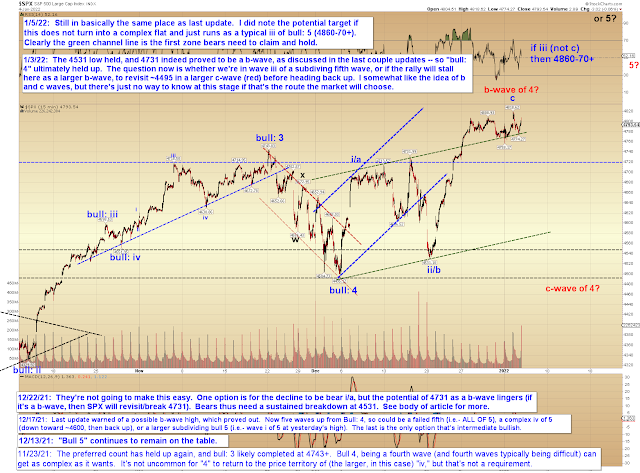
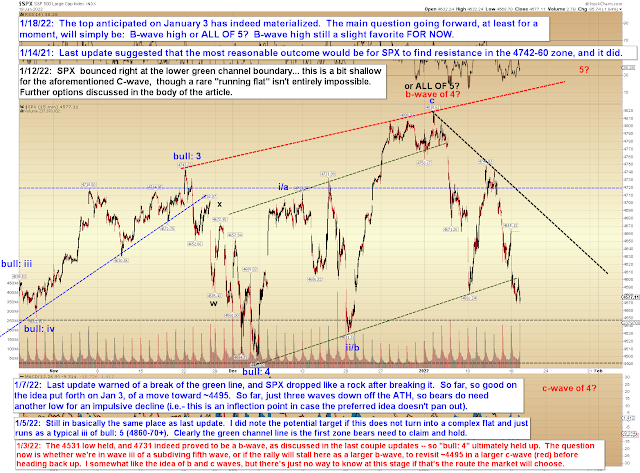
Accordingly, there's not too much to add to this year's updates, except to note the following (discussion on the intermediate-term chart below):


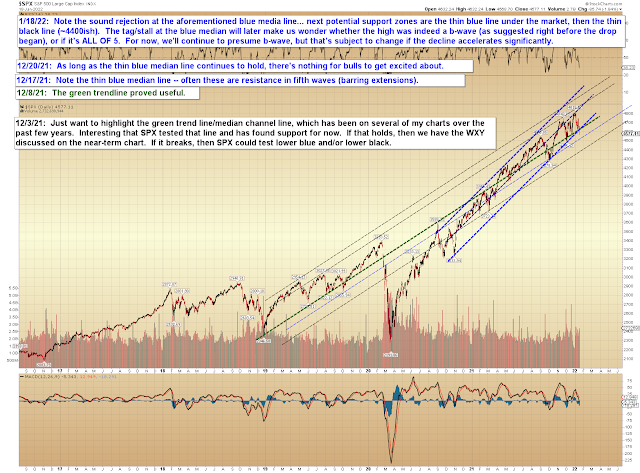
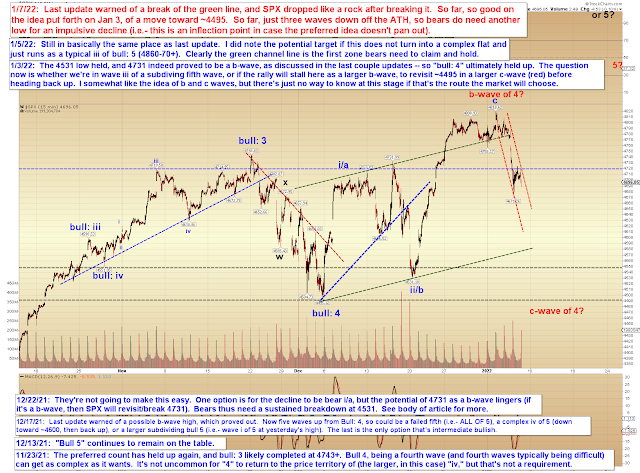
Similar notes on the near-term chart:


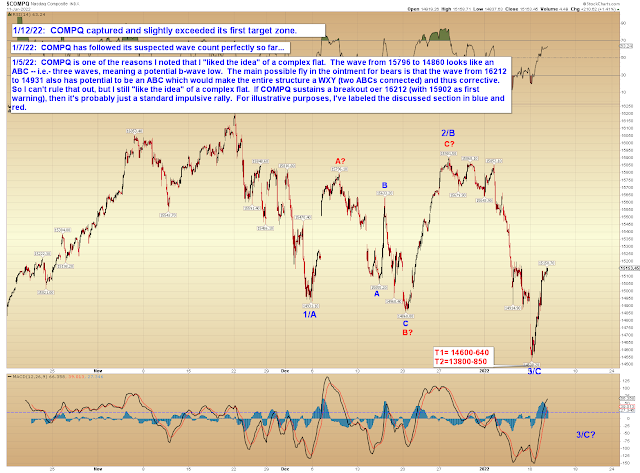
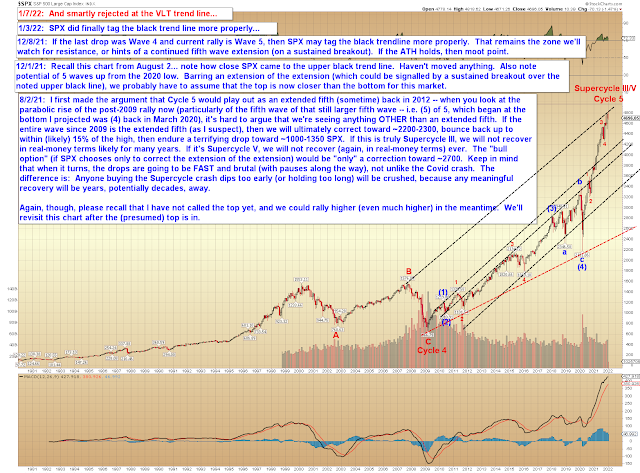
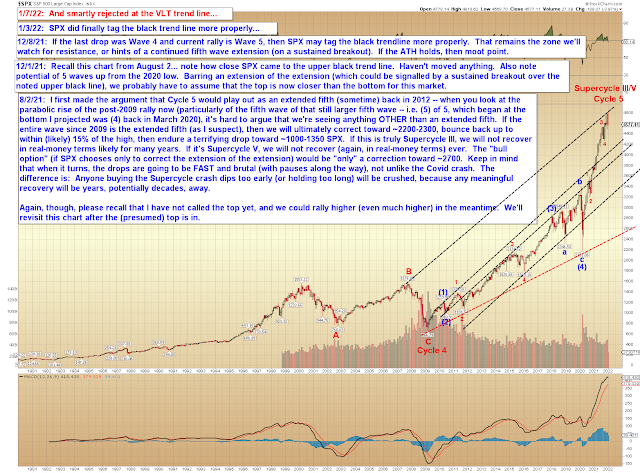
And no update needed to the long-term chart:


In conclusion, SPX continues to be "so far, so good" on following the path I laid out on the first trading day of the year.  The main question we'll face next is whether the decline will remain a c-wave at the discussed degree and thus find support (at least in the foreseeable future) and bounce to a new (potentially final) all-time high, or if it will instead turn into something more ominous.  Trade safe.

Friday, January 14, 2022

SPX Update

Last update laid out some options, with the leading contender being:

I think if I had to pick one, I'd probably lean very, very SLIGHTLY toward option 2, as of this exact moment.

Option 2 was:

2.  The low is a micro b-wave, which could run toward SPX 4742-60 in a micro c-wave, before reversing back to break Monday's low.

And again, "so far, so good."  SPX found solid resistance in the noted zone, leading to a reversal and drop that will exceed 100 points. 


Of course, bears will want to be cautious as we head lower into prior support (it is still three waves down from 4748), and of course would want to be extremely cautious were SPX to sustain a breakout over upper black and particularly over 4749.

Obviously, the 4742-60 resistance zone discussed in last update has at least been good for a solid trade, so other than that, not much to add.  Trade safe.

Wednesday, January 12, 2022

SPX and COMPQ: The Good, the Bad, the Ugly

Last update noted that we were on track for the speculated c-wave, and since then, COMPQ managed to capture its c-wave target, but SPX instead chose to bounce strongly from the lower trend line on the near-term chart.  We'll look at COMPQ first, then move to SPX, where the discussion becomes more detailed:


SPX found support at a trend line that I noted in real-time on the forum:


This SPX bounce opens up some questions/options here from a technical perspective, as follows:

  1. Wave C played out as a running flat in SPX, instead of the more common expanded flat.
  2. The low is a micro b-wave, which could run toward SPX 4742-60 in a micro c-wave, before reversing back to break Monday's low.
  3. The entire larger structure is playing out as an ending diagonal (I mentioned this briefly last year), with the ATH being wave i (or possibly even wave iii) of said diagonal, and the recent drop being wave ii/iv.
  4. SPX is forming a crazy bull nest to launch wave 5 into a large extension.
Of those, the last one "seems" the least reasonable, from a purely rational perspective -- but I suppose we've seen less reasonable things out of this market.

I think if I had to pick one, I'd probably lean very, very SLIGHTLY toward option 2, as of this exact moment.  But that's largely because it seems like the most sensical of the above options -- not because it's particularly clear on the chart.

In conclusion, COMPQ was a hit, but SPX has decided to muddy the water a bit, so we'll see how SPX handles the 42-60 zone first, then take it from there.  Trade safe.

Monday, January 10, 2022

SPX and COMPQ: Still on Target So Far

Since last update, SPX made another new low, adding even more weight to the preferred count.

I didn't update the SPX chart annotation because Stockcharts is back to doing that annoying thing where if I try to update the chart, it deletes ALL my prior annotations:


And I didn't update the COMPQ chart, because there's nothing to update:


In conclusion, "so far, so good" remains the order of the day, and the market so far remains on-pace to play out the preferred count.  Trade safe.

Friday, January 7, 2022

SPX Update: So Far, So Good

For the entirety of 2022 (ha ha), I've noted that I liked the idea of a B-wave high that would lead to a sharp drop in wave C, and so far the market is doing its best to oblige.


Last update's COMPQ chart proved timely:


And the oft-discussed very-long-term (VLT) trend line has held so far:


In conclusion, bears have done what was expected to keep the idea of a C-wave decline at the forefront.  It's worth noting (as I mention on the first chart) that so far the decline from the ATH is only three waves, so we can't entirely rule out things such as an ending diagonal just yet, and that makes yesterday's low a bit of an inflection point -- but if bears can sustain a breakdown there, then that will keep the C-wave on the front burner.  Trade safe.

Wednesday, January 5, 2022

SPX Update: QE is Fun... for a Season

The market is still in basically the same place it was in the last update -- and last update discussed the following:

As I noted on the chart, I somewhat like the idea of a complex flat (red b/c), but there's just no way to "predict" that at this stage.  If the market instead wants to keep running higher in wave iii of blue bull 5, it certainly can do that.

So no real change there, but I have added a bit to the chart:


I also thought there might be value in sharing the chart that caught my eye prior to last update -- the chart that led me to "like the idea" of a complex b-wave/c-wave (below):


Big picture, SPX is still right up against the upper boundary of the very long-term trend channel:


On another note, it's crazy to consider that SPX is now up seven-fold from the 2009 lows, and triple what it was at the 2007 high.  Is the economy three times as strong as it was in 2007?  Of course it isn't.  But $7 trillion in QE buys a lot of feel-good, I suppose.  At least for a while.  Kinda reminds me of something my father liked to quote:  

"Sin is fun for a season."  

In other words: Short-term fun, long-term mess.  The problems always come later, when we have to stare down the consequences.

Beyond that, no material change since last update.  Trade safe.

Monday, January 3, 2022

SPX Update: 2022

So it's now 2022, which means that on January 22 at 10:22:22 p.m., it will be the twenty-second second of the twenty-second minute of the twenty-second hour of the twenty-second day of the twenty-second year of the two-thousands.  

Or something like that.  

Anyway, I hope everyone brought in the New Year safely.

Last update discussed a few possibilities, quote:
  1. A complex b-wave high (slight new high, then back below the blue "bull: 4" label, then back above the ATH). 
  2. A subdividing fifth wave (leading to a solid rally) 
  3. An ending diagonal (with the current rally being iii of said diagonal)
Thanks to Jerome Powell and his magic beans, all three of those options remain on the table.  Let's look at the first two in a bit more detail on the chart below:


As I noted on the chart, I somewhat like the idea of a complex flat (red b/c), but there's just no way to "predict" that at this stage.  If the market instead wants to keep running higher in wave iii of blue bull 5, it certainly can do that.

Of course, in order to do that, it's going to need to stage a breakout over the long-term black line below:


In conclusion, after much ado about nothing, "bull: 4" held up and led to new all-time highs.  From here the market could continue to make things even more complex with another b-wave high, but certainly isn't required to.  Trade safe, and I wish everyone a healthy and prosperous New Year!